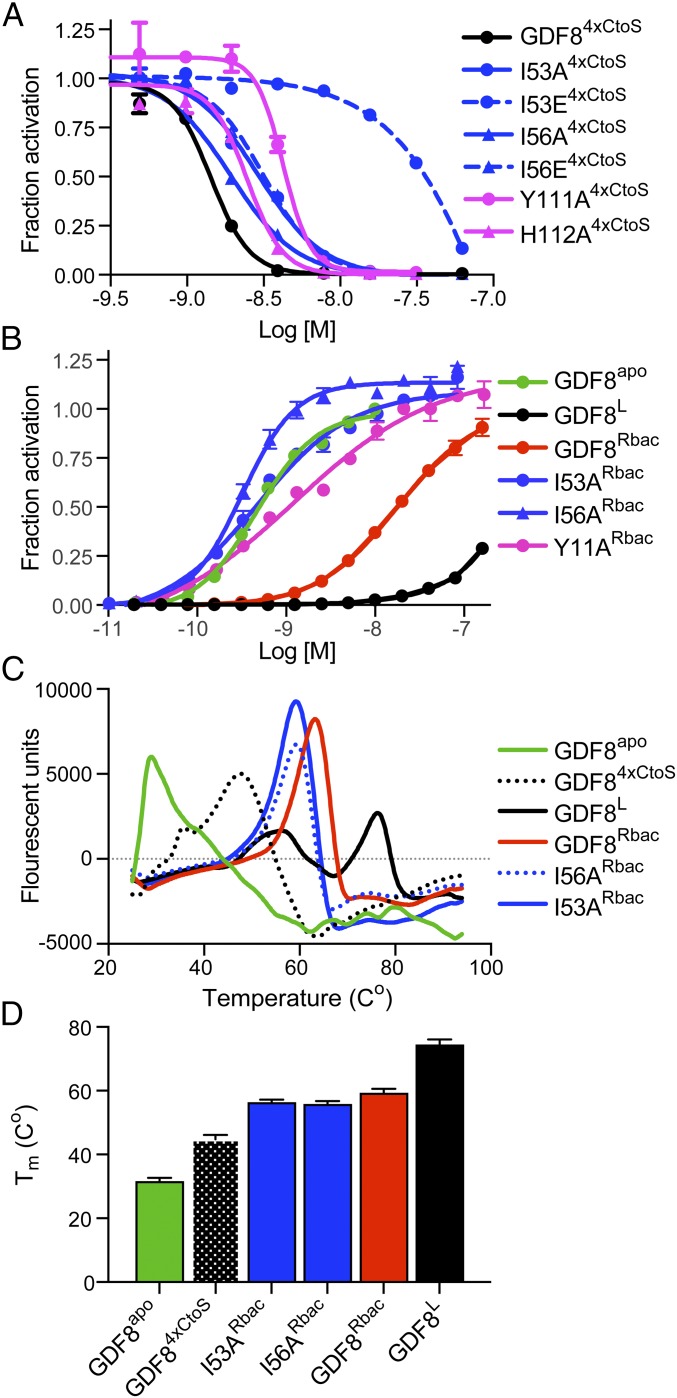
Fig. 4.
Characterization of bacterially produced GDF8 prodomains and purified prodomain:ligand complexes. (A) Representative IC50 curve of serially diluted bacterially expressed prodomains mixed with exogenous, mammalian-derived GDF8apo (0.62 nM) and added to HEK293 (CAGA)12 cells. Fraction activation was calculated using the signal of GDF8apo treated with the prodomain divided by GDF8apo alone or maximum signal. Data were fit to a nonlinear regression with variable slope to determine the IC50. (B) EC50 curves of reformed GDF8 (mammalian-derived) prodomain (bacterial derived) complexes denoted with Rbac superscript. Data were fit by nonlinear regression to a variable slope to determine the EC50. (C) Representative derivative plot of melt curves from 24 to 100 °C generated by thermal shift and reported as fluorescent units. (D) Representative Tm (Co) for each mutant shown in C. All experiments were performed at least twice where individual points were measured in triplicate for A and B and duplicate for C and D. All data are shown as mean ± SEM.

