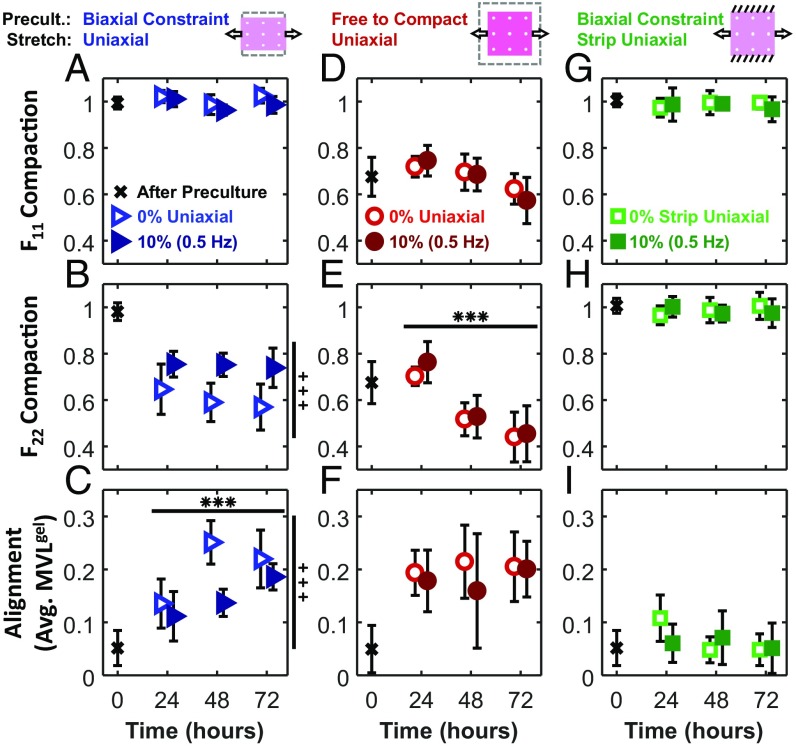
Fig. 2.
Time course of gel deformation and cell alignment at 24, 48, and 72 h. After an initial preculture period (black x), collagen gels were subjected to either 0% stretch (open symbols) or 10% (0.5 Hz) stretch (solid symbols). Compaction deformations in the x1 (F11; A, D, and G) and x2 (F22; B, E, and H) directions were measured using titanium oxide markers. Average MVL (MVLgel; C, F, and I) describes the strength of cell alignment. MA of all uniaxial cases was 0°. Each data point is representative of five independent experiments and expressed as the mean ± SD. ***ANOVA P < 0.001 difference over time; +++ANOVA P < 0.001 difference between 0 and 10% groups.

