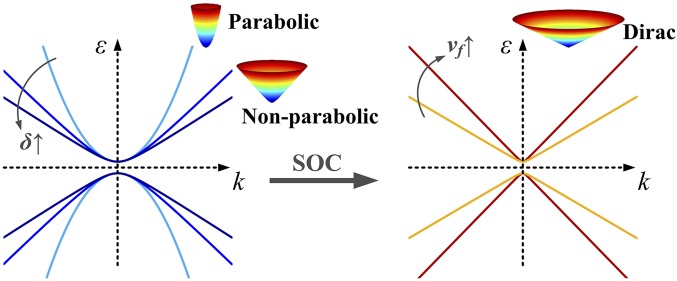
Fig. 1.
A schematic illustration of electronic band structures with different dispersion relations. (Left) Light to dark blue lines show the evolution of the Kane band due to increasing nonparabolicity. (Right) The yellow line indicates the linear dispersion relation of the Dirac band, and the dark red line displays the band shape with a higher Fermi velocity. The rainbow colors on the cones indicate the constant energy contours from a low (colored in blue) to a high (in red) energy level.

