Fig. 1.
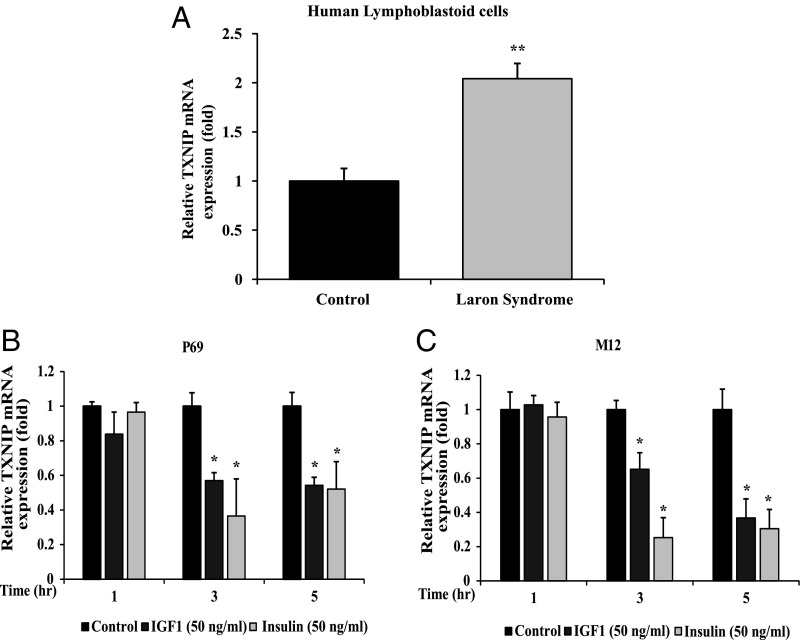
Effect of IGF1 and insulin on TXNIP gene expression. (A) Total RNA was obtained from individual LS and control lymphoblastoid cell lines and TXNIP mRNA levels were measured by RT-QPCR. The bars represent the mean ± SEM of three individual cell lines. **P < 0.01, significantly different versus controls. P69 (B) and M12 (C) prostate cells were deprived of serum for 24 h and then exposed to IGF1 (50 ng/mL, gray bars) or insulin (clear bars) for 1, 3, or 5 h. At the end of the incubation, cells were harvested and levels of TXNIP mRNA were measured by RT-QPCR. The bars represent the mean ± SEM of three independent experiments, each performed in triplicate. *P < 0.01 relative to serum-deprived conditions. A value of 1 was given to TXNIP mRNA levels in control cells (solid bars).

