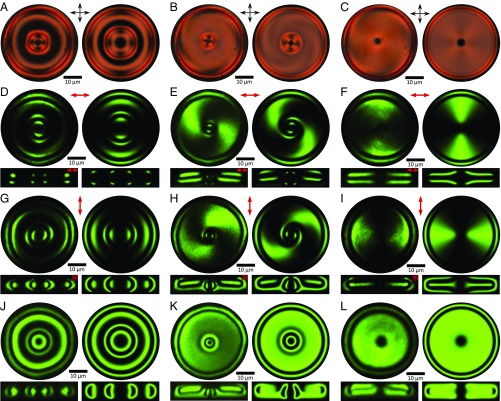
Fig. 4.
Comparison of experimental and computer-simulated optical images of solitons shown in Fig. 3. The images in Left are obtained experimentally, and those in Right are computer-simulated. (A–C) Polarizing optical micrographs of solitons corresponding to Fig. 3 A–C, respectively. (D–L) Cross-sectional nonlinear optical images of solitons corresponding to structures in Fig. 3A (D, G, and J), Fig. 3B (E, H, and K), and Fig. 3C (F, I, and L), respectively. Upper images are midplane cross-sections orthogonal to n0, and Lower images are cross-sections parallel to n0 and passing through the central axes of the solitons. The polarization states of excitation light are linear in D–I, as marked at the top of the images, and are circular in J–L. The solitons are hosted in a partially polymerizable mixture based on AMLC-0010 (Table S2) in a cell with d/p ∼ 1.5.

