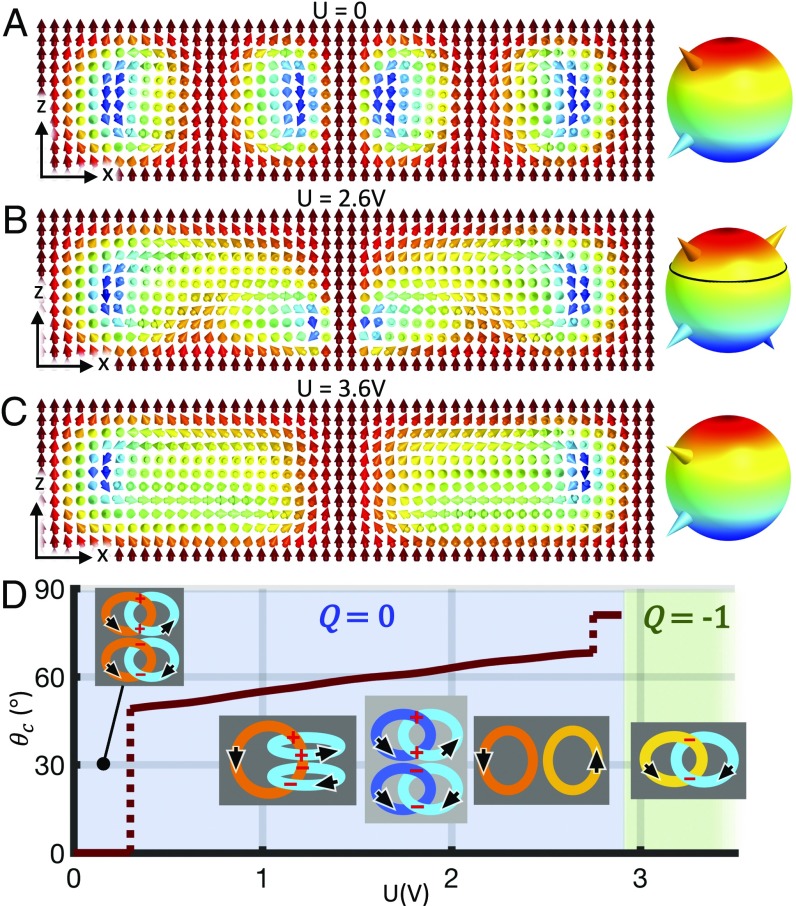
Fig. 5.
Electric switching of Hopf index from Q = 0 to Q = −1. (A–C) Computer-simulated cross-sections of the soliton in the plane orthogonal to n0 at different U. Right shows and points (depicted as cones) corresponding to the preimages provided in D, Insets. For more details on the structure shown in B, see Movie S3. (D) Critical polar angle θc and Q of the soliton vs. U, with abrupt changes of θc at U = 0.3 and 2.8 V and the jump of Q at U = 2.9 V, as marked and shown with different background colors. Schematics of preimage linking within each voltage range are shown as Insets, with the consistently determined circulations shown by black arrows and the signs of crossings marked in red. Computer simulations are based on elastic constants of AMLC-0010 (Table S2) and d/p = 1.35.

