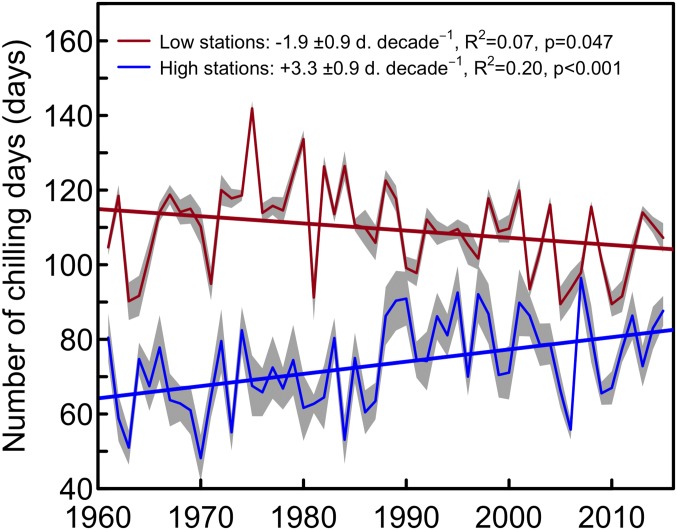
Fig. 3.
Number of chilling days at low- and high-elevation sites during the study period 1960–2016. Long-term series of homogenized temperatures from stations above 808 m (n = 11, mean elevation 1,360 m) were used to count chilling days for high elevations (mean ± SE), whereas weather stations below 522 m (n = 9, mean elevation 414 m) were used for low elevations. These two thresholds correspond to the 33th and 66th percentile of the elevational range of the phenological stations across species. A chilling day corresponds to a day when daily mean air temperature is between 0 °C and 8 °C from November to the mean date of leaf-out across years and species.

