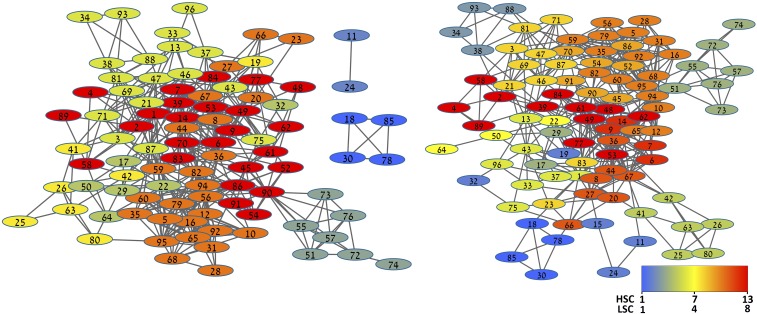
Fig. 1.
(Left) LSC and (Right) HSC networks with links above TH = 0.1. The nodes are numbered according to their labels (Table S1) and colored from blue to red according to their percolation order. The colder (blue) the node is, the earlier it was disconnected from the giant component, and therefore, it is weaker connected to the entire network. Because the number of components is different in both networks, the scales are different.

