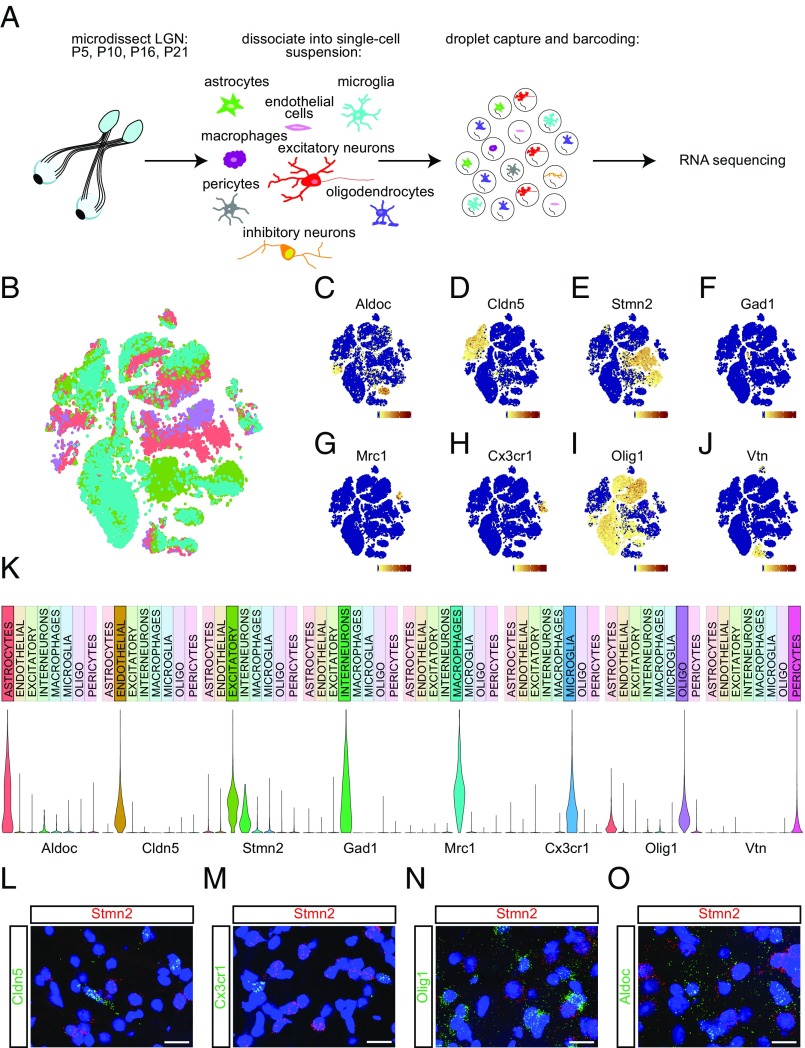
Fig. 1.
Capture, sequencing, and classification of cell types. (A) Schematic of the experimental design. Dorsal LGNs were microdissected from mice at four developmental ages: P5, P10, P16, or P21. Tissue was dissociated into a single-cell suspension, and then cells were captured and barcoded using the inDrops platform. Libraries were prepared and whole-transcriptome RNA sequencing was performed. (B) t-SNE plot of all cell types clustered by principal component analysis. Purple, P5; pink, P10; green, P16; teal, P21. (C) Expression pattern of the astrocyte marker Aldoc across cell clusters. (Scale, 0 to 150 transcripts per cell.) (D) Expression pattern of the endothelial cell marker Cldn5 across cell clusters. (Scale, 0 to 200 transcripts per cell.) (E) Expression pattern of the excitatory neuron marker Stmn2 across cell clusters. (Scale, 0 to 120 transcripts per cell.) (F) Expression pattern of the inhibitory neuron marker Gad1 across cell clusters. (Scale, 0 to 70 transcripts per cell.) (G) Expression pattern of the macrophage marker Mrc1 across cell clusters. (Scale, 0 to 225 transcripts per cell.) (H) Expression pattern of the microglial marker Cx3cr1 across cell clusters. (Scale, 0 to 120 transcripts per cell.) (I) Expression pattern of the oligodendrocyte marker Olig1 across cell clusters. (Scale, 0 to 320 transcripts per cell.) (J) Expression pattern of the pericyte marker Vtn across cell clusters. (Scale, 0 to 200 transcripts per cell.) (K) Violin plots displaying normalized expression levels of each cell type-specific marker across all cell types. (L–O) Confocal images of coronal LGN sections following FISH, probed for the excitatory neuron marker Stmn2 (red) and endothelial cell marker Cldn5 (green; L); microglial marker Cx3cr1 (green; M); oligodendrocyte marker Olig1 (green; N); and astrocyte marker Aldoc (green; O). (Scale bars, 10 μm.)

