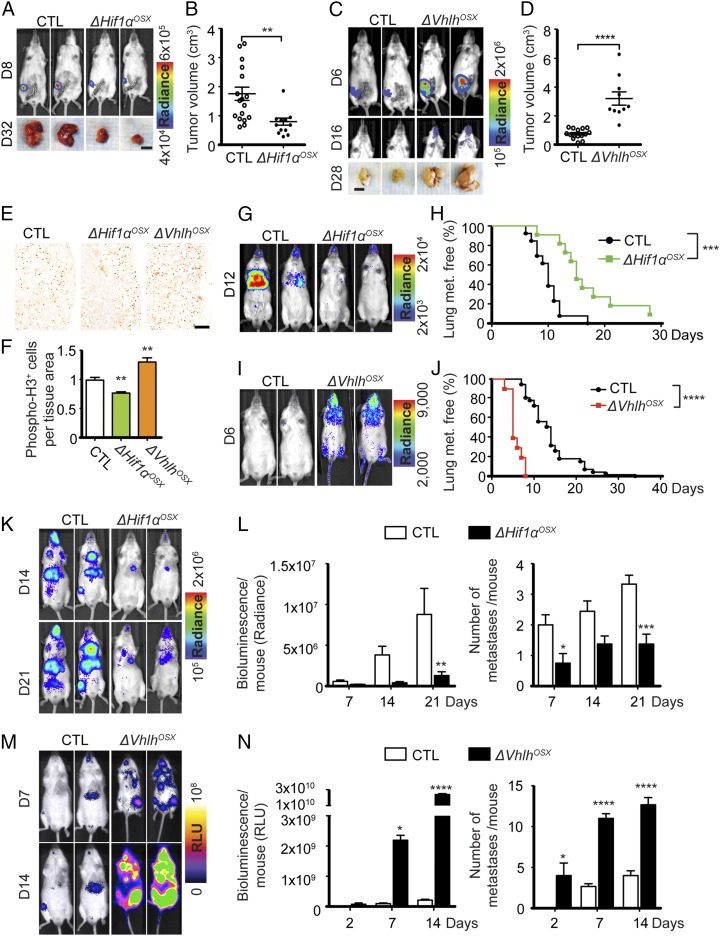
Fig. 3.
HIF signaling in osteoblast-lineage cells promotes systemic breast cancer growth and dissemination. (A and B) Representative bioluminescent images and mammary tumor photographs (A) and quantification of tumor volumes (B) 32 d after i.f.p. transplantation of 105 BCC-GFP::LUC cells in control (n = 17) and ΔHif1αOSX (n = 12) mice. (C and D) Representative bioluminescent images of mammary tumors and disseminated tumor cells and photographs of mammary tumors (C) and quantification of tumor volumes (D) 28 d after i.f.p. transplantation of 104 BCC-GFP::LUC cells in control (n = 15) and ΔVhlhOSX (n = 10) mice. (E and F) Representative images of phospho-histone H3 immunostaining showing mitotic cells in mammary tumors harvested 12 d post i.f.p. transplantation (E) and quantification of positive cells per tissue area (F), normalized to control (control: n = 7; ΔHif1αOSX: n = 4; and ΔVhlhOSX; n = 6). (G and I) Representative bioluminescent images obtained after i.v. injections of BCC-GFP::LUC cells. (H and J) Kaplan–Meier analyses of lung metastasis after i.v. injections of BCC-GFP::LUC cells in control (H: n = 13; J: n = 37) and ΔHif1αOSX (H, n = 11) or ΔVhlhOSX mice (J, n = 10). (K–N) Representative bioluminescent images (K and M) and quantification of the total bioluminescent signal per mouse [in relative light units, (RLU) or radiance] and of the number of metastases detected by bioluminescence (L: n = 8; N: n = 3) for each group after i.c. injections of BCC-GFP::LUC cells. (Scale bars: 1 cm in A and C; 200 µm in E.) Values indicate the mean ± SEM, *P < 0.05, **P < 0.01, ***P < 0.001, ****P < 0.0001, two-tailed Student’s t test (B, D, and F), log-rank (Mantel–Cox) test (H and J), or two-way ANOVA (L and N).

