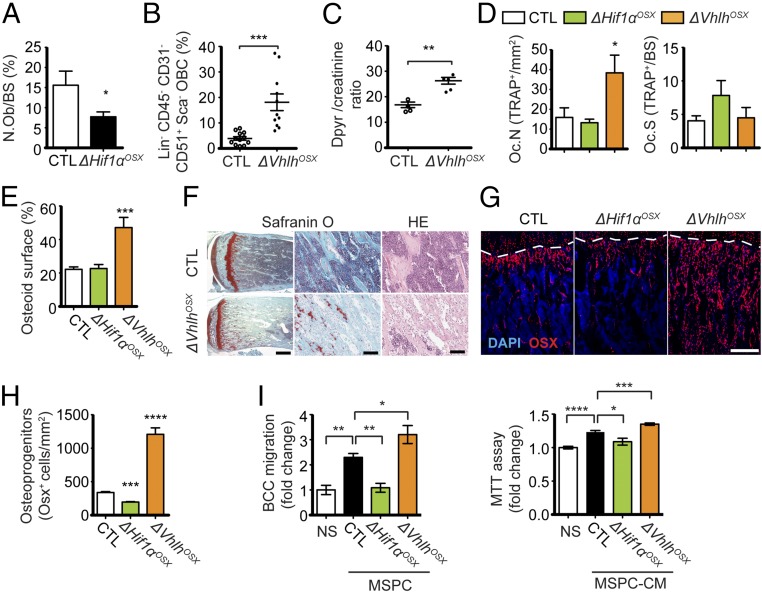
Fig. 4.
HIF signaling controls the pool of skeletal progenitors, which directly promotes breast cancer cell migration and proliferation. (A) Quantification of osteoblast numbers expressed as the percentage of bone surface in control (n = 6) and ΔHif1αOSX (n = 7) mice. (B) FACS analysis of lineage-negative (Lin−) CD45− CD31− CD51+ Sca1− osteoblast-lineage cells (OBCs) from crushed bones of control (n = 12) and ΔVhlhOSX (n = 11) mice, expressed as percentages of total cells. (C) Dosage of deoxypyridinoline normalized to creatinine in urine of control (n = 4) and ΔVhlhOSX (n = 5) mice. (D) Histomorphometric analysis of tartrate-resistant acid phosphatase-positive (TRAP+) osteoclast numbers per tissue area (Oc.N) or per bone surface area (Oc.S) in control (n = 8), ΔHif1αOSX (n = 5), and ΔVhlhOSX (n = 3) mice. (E) Histomorphometric quantifications of the osteoid surface (immature bone) done on 8-wk-old femur sections stained with toluidine blue. Values are expressed as the percentage of bone surface in control (n = 9), ΔHif1αOSX (n = 6), and ΔVhlhOSX (n = 3) mice. (F) Representative images of Safranin O staining of mouse hind limbs showing increased unmineralized bone matrix (stained in light blue) and cartilage remnants (stained in red) in the metaphyseal area of ΔVhlhOSX bone. H&E (HE) staining reveals fibrotic tissues with expansion of undifferentiated stromal cells in the metaphyseal area of ΔVhlhOSX hind limbs. (G) Immunostaining showing OSX+ OPCs (in red) in mouse hind limbs. Dashed lines indicate the limit between cartilage (above the dashed line) and bone (below the dashed line). (H) Quantification of OSX+ cells per tissue area (n = 3). (I) Migration assay (Left) and 3-[4,5-dimethylthiazol-2-yl]-2,5-diphenyltetrazolium bromide (MTT) assay (Right) with BCC-GFP::LUC cells (BCC) not stimulated (NS: serum-free medium) or cocultured with MSPCs (Left) or stimulated with MSPC-conditioned medium (MSPC-CM, Right) derived from control (n = 4), ΔHif1αOSX (n = 3), and ΔVhlhOSX (n = 4) mice. Values are normalized to NS controls. (Scale bars: 1 mm in F, Left; 100 μm in F, Middle and Right; 200 μm in G.) Values indicate the mean ± SEM, *P < 0.05, **P < 0.01, ***P < 0.001, ****P < 0.0001, two-tailed Student’s t test.

