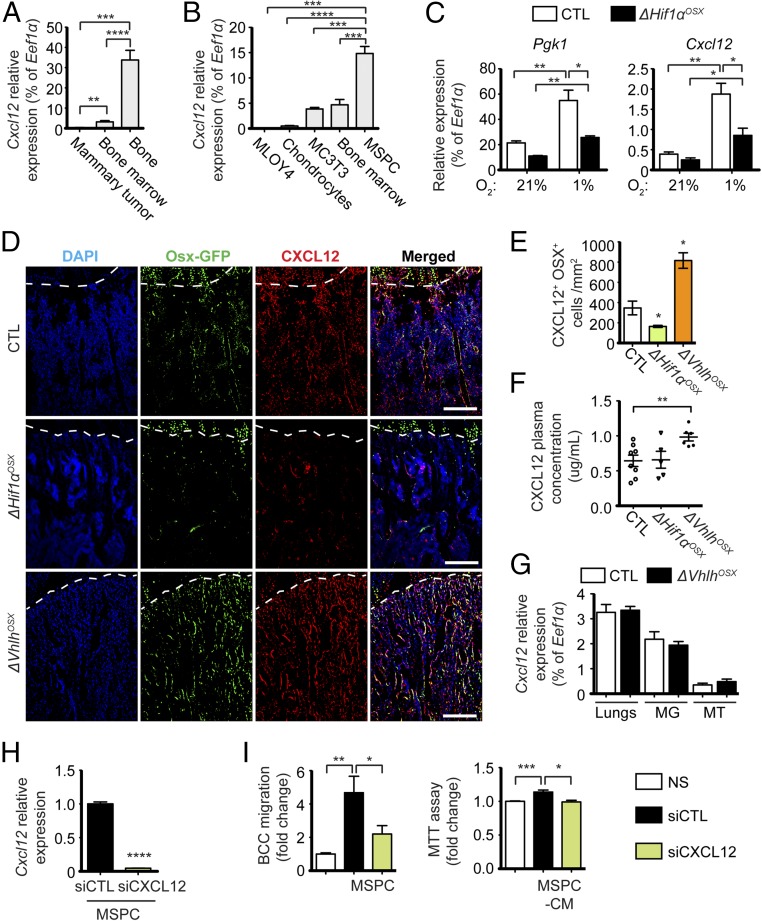
Fig. 5.
Hypoxic skeletal progenitors produce CXCL12 to induce breast cancer cell migration and proliferation. (A and B) Relative expression of Cxcl12 in different tissues collected from wild-type mice (n = 4) (A) and in different skeletal cell types (n = 3) (B). (C) Relative mRNA expression of Pgk1 (HIF1α target gene) and Cxcl12 in bone explants incubated in 21% or 1% O2 for 72 h and obtained from control and ΔHif1αOSX mice (n = 4). (D and E) Representative images (D) and quantification (E) of CXCL12-expressing OPCs per tissue area of immunostaining against GFP (Osx-GFP, in green) and CXCL12 (in red) in control, ΔHif1αOSX, and ΔVhlhOSX hind limbs (n = 3). The dashed lines indicate the limit between cartilage (above the dashed line) and bone (below the dashed line). (F) Plasma concentrations of CXCL12 measured by ELISA in control (n = 8), ΔHif1αOSX (n = 5), and ΔVhlhOSX (n = 6) mice. (G) Relative mRNA expression of Cxcl12 in the lungs (n = 3), mammary glands (MG; n = 3), and mammary tumors (MT; n = 4) obtained 30 d after i.f.p. transplantation of BCC-GFP::LUC in control and mutant mice. (H) Relative mRNA expression of Cxcl12 in MSPCs transfected with control siRNA (siCTL) or siRNA targeting Cxcl12 (siCXCL12) (n = 3). (I) Migration and MTT assays on BCC-GFP::LUC cells cocultured with MSPCs or stimulated with conditioned medium (CM) obtained from transfected MSPCs (n = 3). Values are normalized to nonstimulated (NS) controls. (Scale bars: 200 µm.) Values indicate the mean ± SEM; *P < 0.05, **P < 0.01, ***P < 0.001, ****P < 0.0001, two-tailed Student’s t test.

