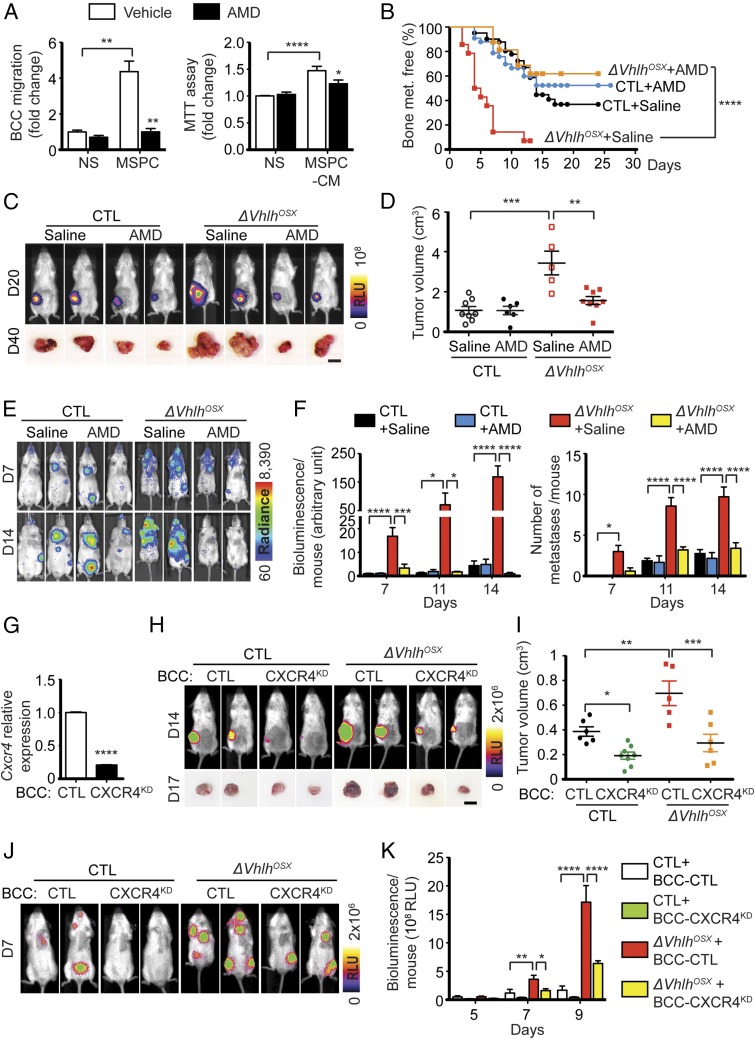
Fig. 6.
CXCL12–CXCR4 signaling mediates systemic breast cancer growth and dissemination induced by the skeleton. (A) Migration and MTT assays with BCC-GFP::LUC cells stimulated by MSPCs (Left) or conditioned medium (Right) in presence or absence of the CXCR4 inhibitor AMD3100. Values (n ≥ 4) are normalized to nonstimulated (NS) controls. (B) Kaplan–Meier analysis of bone metastasis after i.c. injections of BCC-GFP::LUC cells in control mice treated with saline (n = 31) or AMD3100 (n = 37) and in ΔVhlhOSX mice treated with saline (n = 14) or AMD3100 (n = 16). (C and D) Representative bioluminescent images and tumor photographs obtained after i.f.p. transplantation of BCC-GFP::LUC cells (C) and quantification of tumor volumes at day 40 (control + saline, n = 8; control + AMD3100 MD, n = 6; ΔVhlhOSX + saline, n = 5; ΔVhlhOSX + AMD3100, n = 8) (D). (E and F) Representative images (E) and quantifications of the total bioluminescence and numbers of metastases per mouse (F) after i.c. injections of BCC-GFP::LUC cells (n ≥ 4 for each group). (G) Relative mRNA expression of Cxcr4 in BCC-GFP::LUC cells infected with control lentiviruses (BCC-CTL) or with lentiviruses encoding shRNA against Cxcr4 (BCC-CXCR4KD) (n = 3). (H and I) Representative bioluminescence images and tumor photographs (H) and quantifications of tumor volumes (I) 17 d after i.f.p. transplantation of BCC-CTL (n = 6 for control; n = 5 for ΔVhlhOSX mice) or BCC- CXCR4KD (n = 8 for control; n = 6 for ΔVhlhOSX mice). (J and K) Representative images (J) and quantifications of the total bioluminescence per mouse (K) after i.c. injections of BCC-CTL or BCC-CXCR4KD in control or ΔVhlhOSX mice (n ≥ 3 for each group). (Scale bars: 1 cm.) Values indicate the mean ± SEM; *P < 0.05, **P < 0.01, ***P < 0.001, ****P < 0.0001; two-tailed Student’s t test (A and G), log-rank (Mantel–Cox) test (B), or two-way ANOVA (D, F, I, and K).

