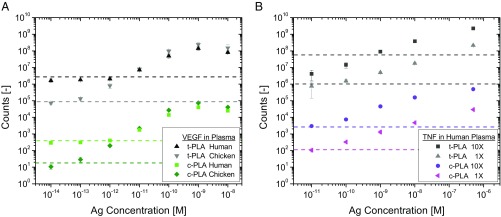
Fig. 5.
Performance of PLAs in human plasma. (A) Dose–response curves for VEGF detection show assay compatibility for both PLA methods in human and chicken plasma. The difference in limit of detection between the two matrices is attributed to endogenous VEGF levels in human plasma that are absent in chicken plasma. (B) Dose–response curves for TNF-α detection in human plasma showing improvement in assay performance for c-PLA over t-PLA. A 10-fold increase in probe concentration (10× = 2.5 nM) improves reproducibility for c-PLA, while there is no improvement for t-PLA. Error bars denote 1 SD (n = 9), and the dashed lines denote limit of detection, defined as the mean signal of a blank sample +3 SD. Ag, antigen.

