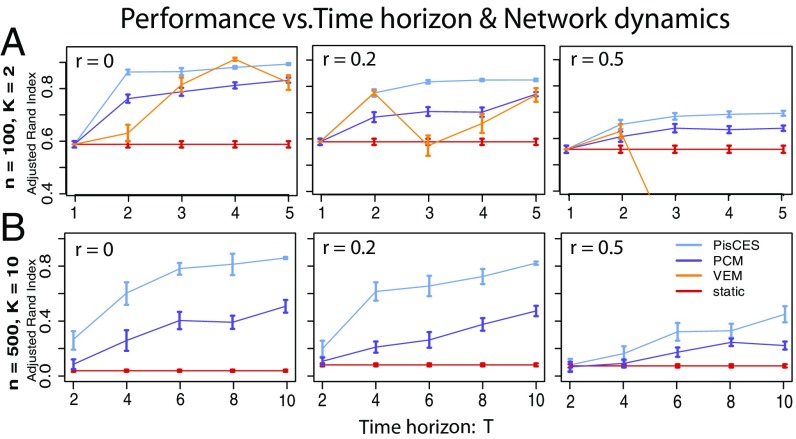
Fig. 1.
Performance on synthetic networks as a function of time horizon and class dynamics, as measured by the adjusted Rand index between true and estimated community labels. Networks were generated under a dynamic DCBM (Eqs. 13–15) with three key parameters: and , which determine the in-cluster and out-of-cluster edge probability/density, and , which determines the amount of change in cluster memberships between consecutive networks (0 for no change). For A, , and for B, . Shown are 100 simulations per data point.

