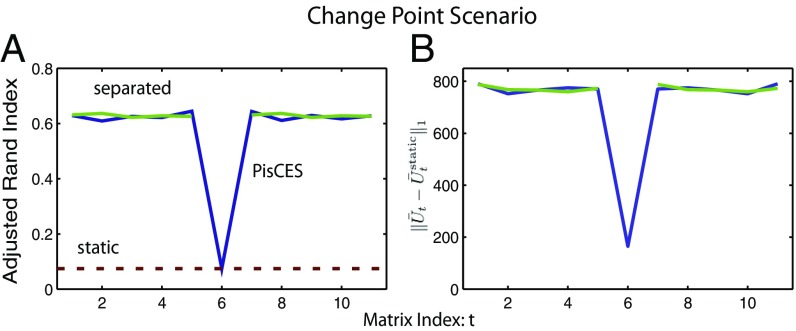
Fig. 3.
Performance of PisCES in a scenario with outlier at time (main text). Simulations were generated from a dynamic DCBM with , , , , for , and outside the change point. (A) ARI performance of PisCES applied to (blue line), static spectral clustering (static, red dashed line), and PisCES applied separately to and to (“separated,” green lines). (B) , where is the output of PisCES (green) or “separate” (blue), and is the output of static.

