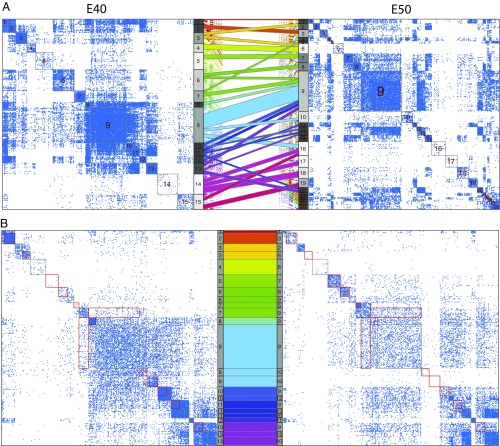
Fig. 6.
(A) Sankey plot for stages E40 and E50 only, along with the thresholded Laplacian matrices LE40 and LE50 corresponding to those stages. (B) Submatrices of LE40 and LE50 corresponding to those genes in large flows between E40 and E50 (excluding E40 communities 14 and 15). To facilitate comparison, the genes in LE50 have been reordered to match their ordering in LE40. Red boxes highlight large difference between the submatrices. In both A and B, the flow colors match their coloring in Fig. 5.

