Fig. 2.
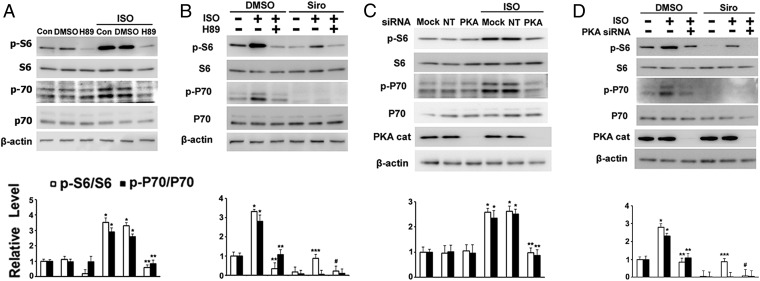
Effects of H89 or PKA Cα knockdown on phosphorylation of S6 and P70 in TSC2+/− cells. (A) TSC2+/− cells were incubated for 1 h with DMSO or 10 μM H89, followed by 1 h with addition of 1 μM isoproterenol (ISO) before analysis of indicated proteins by Western blotting and densitometric quantification. *P < 0.01 vs. DMSO; **P < 0.01 vs. DMSO + ISO. (B) After a 1-h incubation with DMSO, 10 μM H89, or 200 nM sirolimus (Siro), cells were incubated for 1 h with addition of 1 μM ISO before analysis of indicated proteins by Western blotting and densitometric quantification. *P < 0.05 vs. DMSO; **P < 0.005 vs. DMSO + ISO; ***P < 0.01 vs. Siro; #P < 0.01 vs. Siro + ISO. (C) After a 72-h incubation with vehicle alone (Mock) or with nontargeted (NT) or PKA Cα siRNA (PKA), cells were incubated for 1 h with 1 μM ISO before analysis by Western blotting with indicated antibodies and densitometric quantification. *P < 0.05 vs. NT siRNA; **P < 0.01 vs. NT siRNA + ISO. (D) After a 72-h depletion of PKA Cα, cells were incubated for 1 h with DMSO or 200 nM Siro, followed by a 1-h incubation with additional 1 μM ISO before analysis by Western blotting with indicated antibodies and densitometric quantification. *P < 0.01 vs. DMSO; **P < 0.05 vs. DMSO + ISO; ***P < 0.01 vs. Siro; #P < 0.05 vs. Siro + ISO. Fig. S3 shows the effects on 4EBP1 and ULK1.

