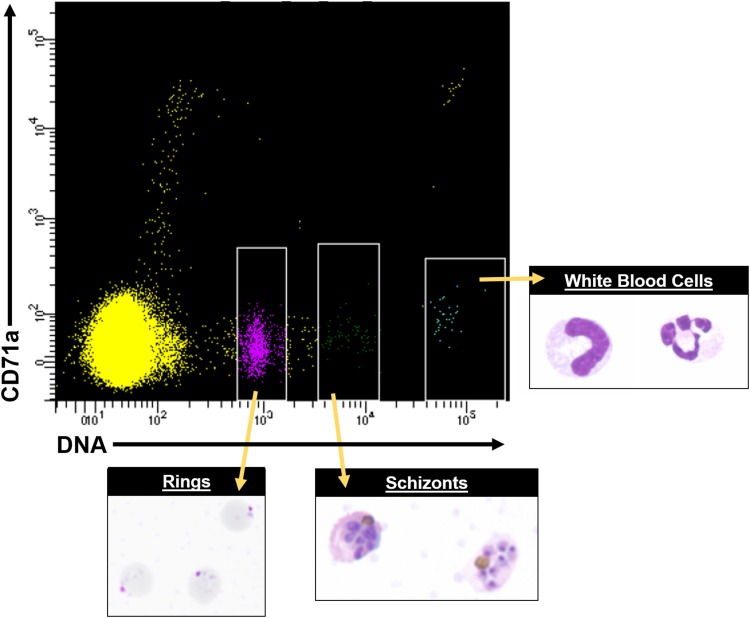
Fig. 6.
FACS data showing distinct cell populations, including different parasite stages from P. knowlesi infected blood, using antibodies conjugated to fluorophores and Hoechst 33342 DNA dye. A representative FACS plot from multiple experiments is shown. White rimmed boxes indicate specific cell populations that were sorted based on the single-cell expression of CD71a and DNA content, demonstrating the ability to resolve infected RBCs from white blood cells and uninfected RBCs. A representative image of each sorted population is provided. FACS, fluorescent activated cell sorting.

