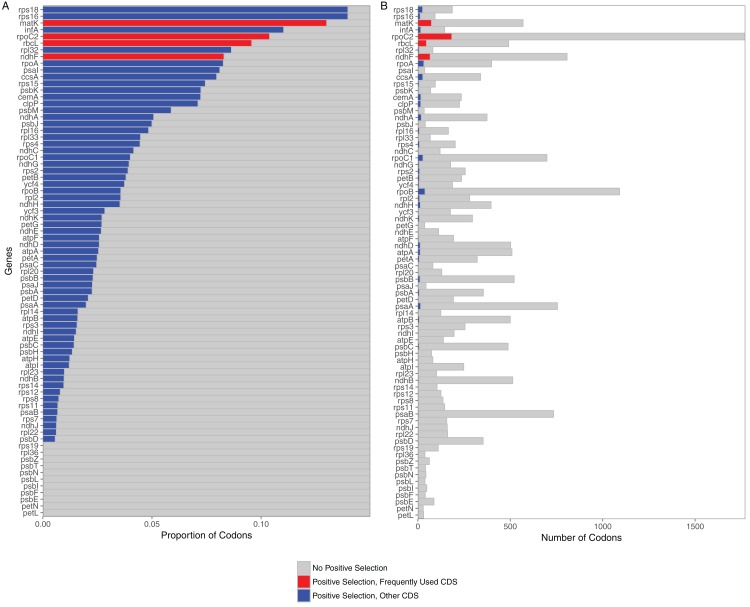
Figure 1. Proportion and raw numbers of positively selected codons for each plastome protein coding sequence (CDS).
(A) Proportion of codons. (B) Number of codons. Red represents positive selection in CDS that are commonly used in phylogenetic studies, while blue represents positive selection in other CDS. Proportionate data are only represented up to 0.15 selected codons for clarity of illustration.

