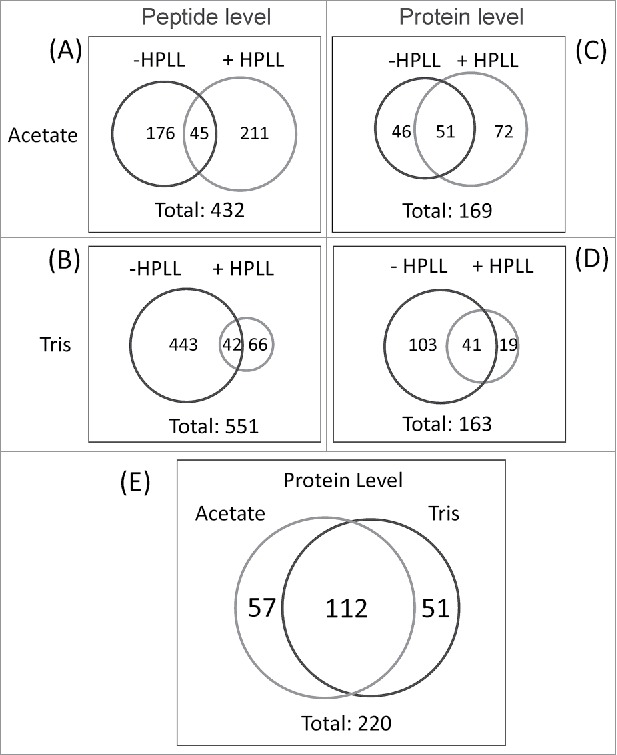
Figure 3.

(A) Venn diagram representing the number of peptides identified after the equalization process with two buffers (buffer A: 25 mM sodium acetate, pH 5.0 and buffer B: 25 mM Tris/HCl, pH 9.0). (B) Venn diagram representing the amount of proteins identified after the equalization process with the same two buffers.
