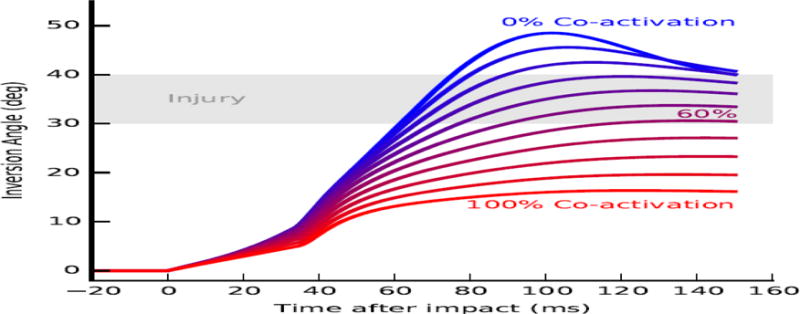
Figure 4.

Ankle inversion trajectories immediately after impact for various levels of evertor and invertor muscle co-activation. Each contour represents excursion of the subtalar joint during a single simulation in which the evertor and invertor muscles generated force due to constant activation. Co- activation level was varied from 0% (blue) to 100% (red). Impact occurs at zero milliseconds (ms). An approximate injury threshold of 30 to 40 degrees inversion (Aydogan et al., 2006) is shown for reference (gray area).
