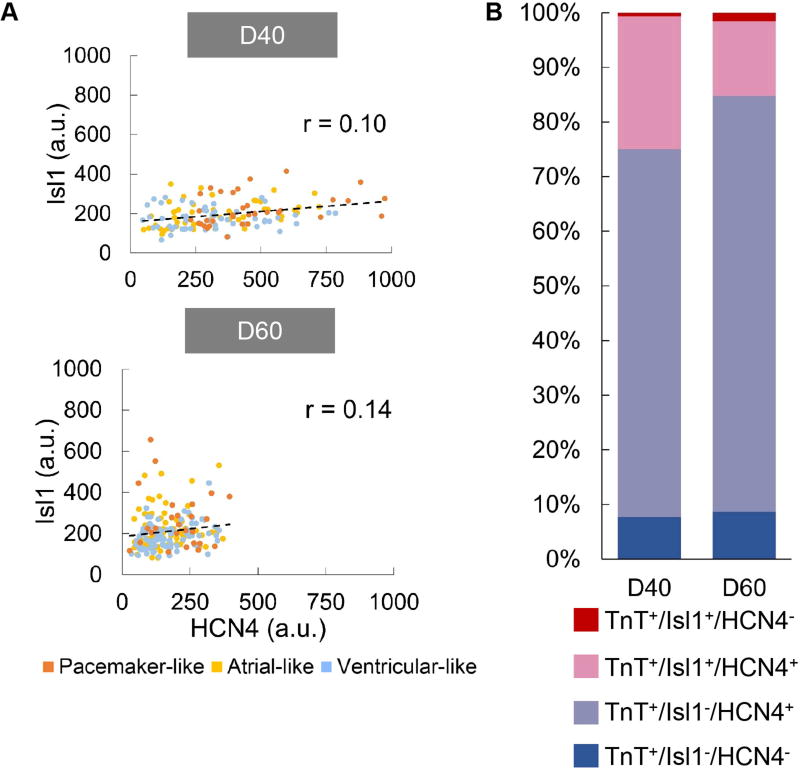
Figure 7. Correlation of Isl1 to HCN4 expression hiPSC-derived cardiomyocytes.
A) Correlation plots for Isl1 vs. HCN4 in hiPSC-derived cardiomyocytes on day 40 (D40, n=142) and 60 (D60, n=190) post-differentiation. Pearson’s coefficient (r) for each correlation is shown. There is no significant correlation between Isl1 and HCN4 as indicated by the r value. B) Distribution of HCN4+ and Isl1+ cells in D40 and D60 hiPSC-derived cardiomyocytes identified as troponin T (TnT)+ cells. (a.u.: arbitrary units)

