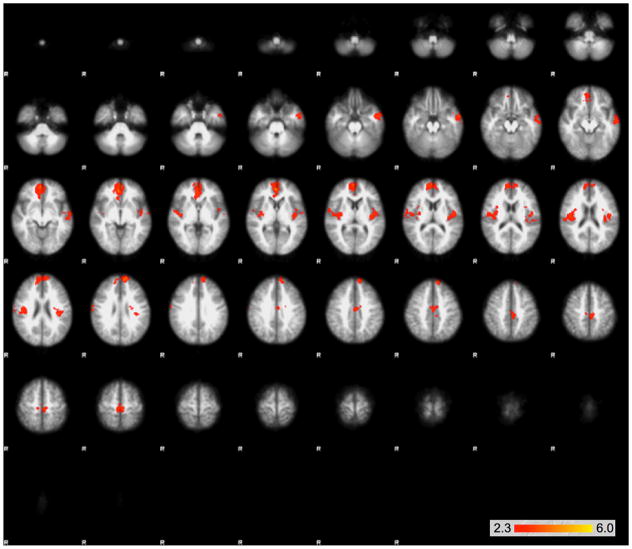
Fig. 2.
Large clusters of activation that were significantly greater in the certain than the uncertain condition as determined by the GLM using FEAT. Clusters are shown on serial axial slices, with z score reflected by color bar. There were three significantly different clusters extending bilaterally from the insula into the parietal/temporal boundary, as well as a single midline frontal cluster

