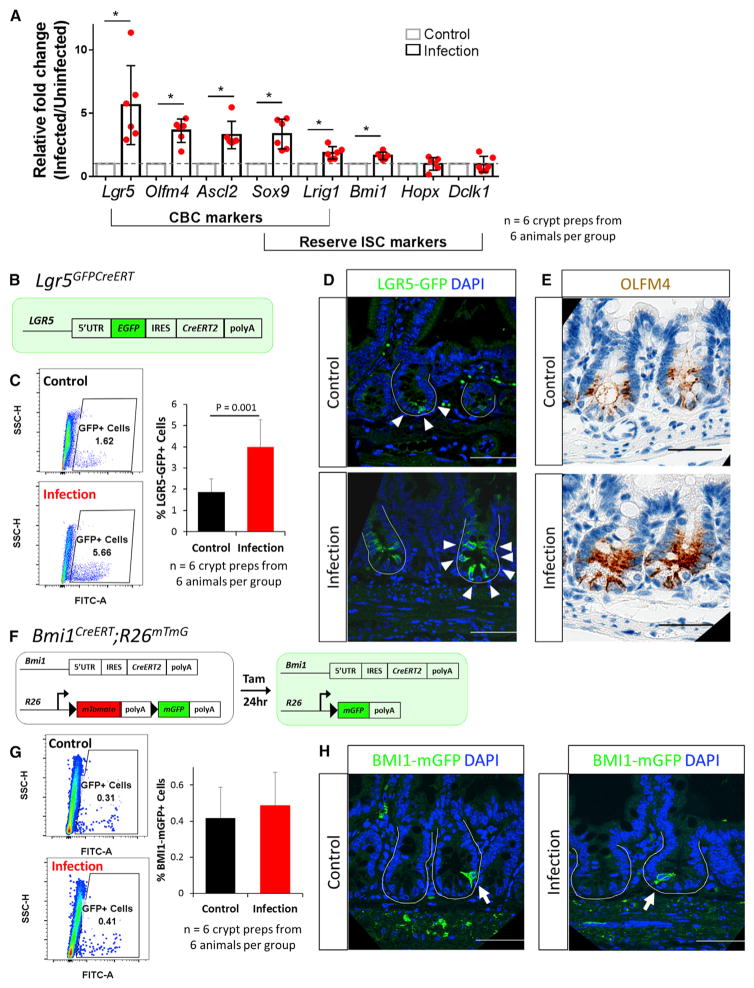
Figure 3. CBCs Are Induced following RV Infection.
(A) qRT-PCR results showed upregulation of all CBC markers and some reserve ISC markers.
(B) Schematic of Lgr5GFPCreERT mice. Cells expressing LGR5 are green.
(C) Representative flow cytometry analysis on control- and RV-infected Lgr5GFPCreERTmice. Quantification of GFP+ cells using flow cytometry analysis on crypt-enriched epithelial preparations.
(D) Representative confocal images of Lgr5GFPCreERT mice following control- and RV-infection. White arrowheads denote GFP+ cells.
(E) Representative light microscopy images of OLFM4 immunohistochemistry staining in control- and RV-infected animals.
(F) Schematic of Bmi1CreERT;R26mTmG mice.
(G) Representative flow cytometry analysis on control- and RV-infected Bmi1CreERT;R26mTmG mice. Quantification of BMI1-mGFP+ cells using flow cytometry analysis on crypt-enriched epithelial preparations.
(H) Representative confocal images of BMI1-mGFP+ mice following control- and RV-infection. White arrows denote BMI1-mGFP+ cells.
Scale bars, 50 μm.

