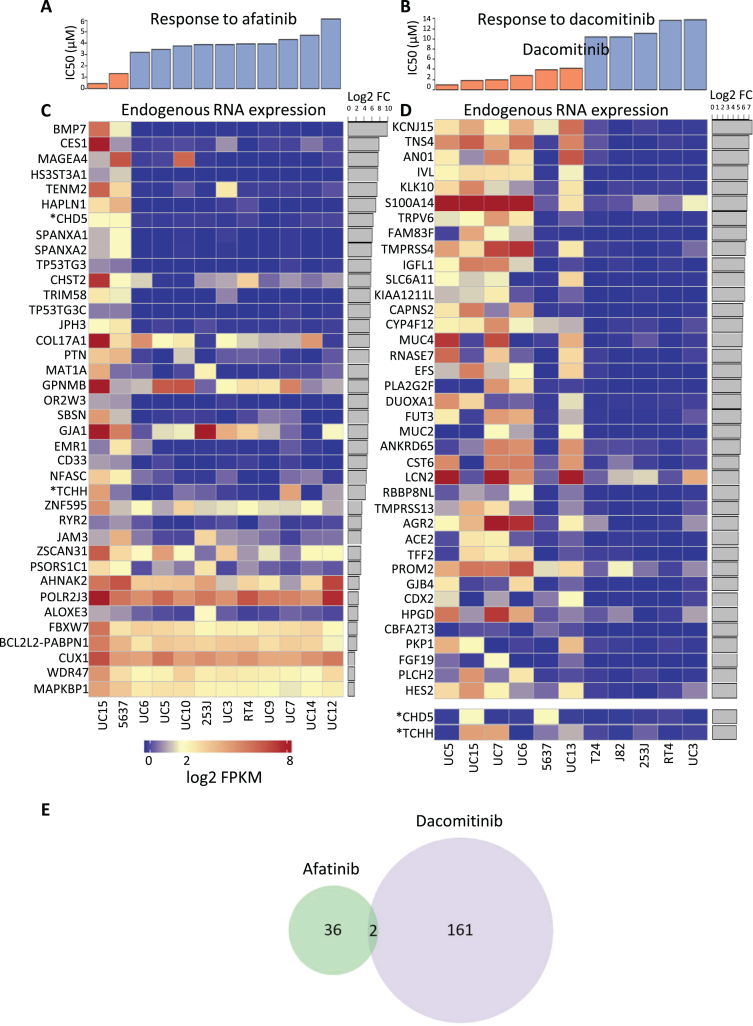
Fig.3.
Cell lines were categorized as either sensitive or resistant to each TKI and then endogenous RNA expression was compared between sensitive and resistant cell lines. Cytotoxic response to (A) afatinib or (B) dacomitinib treated cells which are separated into groups of sensitive (orange) or resistant (blue). DESeq was used to quantify differences between the endogenous RNA expression of sensitive and resistant cell lines for each drug. Afatinib and dacomitinib had 38 and 163 genes identified, respectively, using fold change ≥2 and an FDR adjusted p-value ≤0.05 threshold. Median expression for all cell lines was 2. All log2(FPKM) values represented have been upper quartile normalized. Heat map depiction of the top 38 up-regulated differentially expressed genes for (C) afatinib and (D) dacomitinib sensitive cell lines versus resistant bladder cell lines. Two additional upregulated genes marked with “*”, CHD5 and TCHH, were included for dacomitinib despite not being in the top 38 up-regulated genes. These genes were included because they are (E) the only 2 genes overlapped between the up-regulated, differentially expressed genes for each drug. P-value for overlap was not significant (≥0.01).

