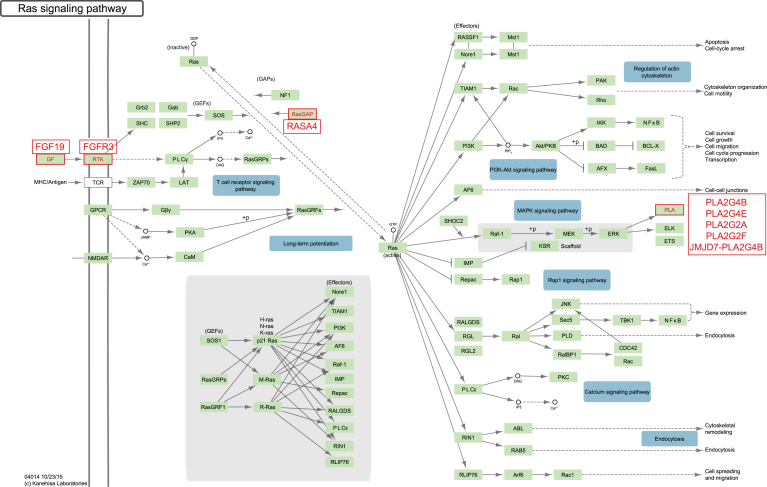
Fig.4.
DESeq analysis revealed RAS pathway involvement. The diagram is courtesy of the Kyoto Encyclopedia of Genes and Genomes (KEGG) [52, 73, 74]. Cell lines sensitive to dacomitinib have a higher expression of several RAS signaling pathway components. FDR adjusted p-value = 0.005 using Fisher’s exact test. All genes highlighted in red were differentially expressed with fold change ≥2 and FDR qValue ≤0.05.

