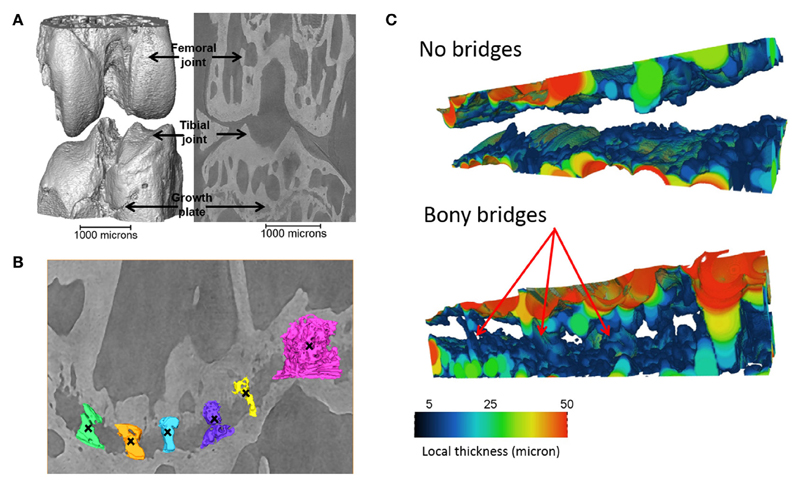
Figure 1.
Identification of the bridges crossing the growth plate (A) 3D representation of the whole joint, (B) bridges crossing the growth plate, in an ROI (black crosses indicate bony bridges identified by an observer). (C) 3D representation of the growth plate with no bridges and multiple bridges observed. Adapted from Staines et al. (2016).

