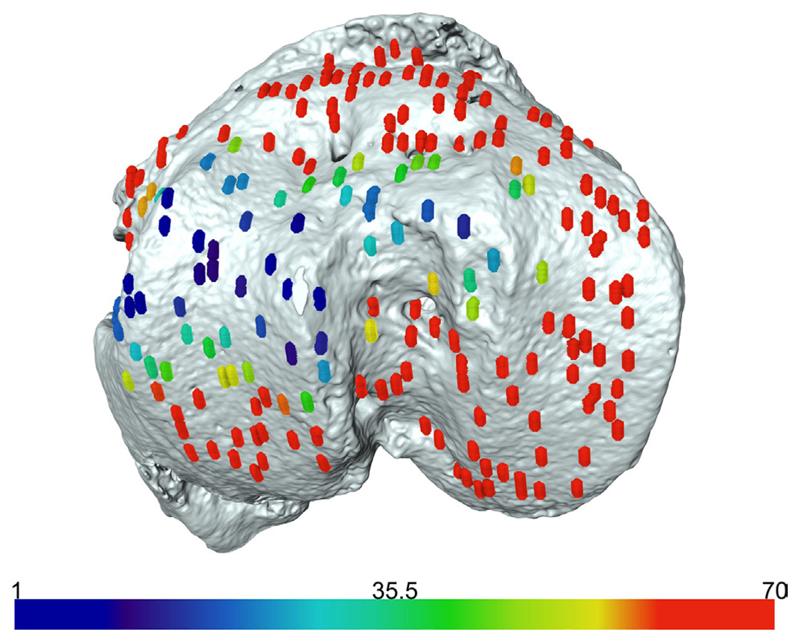
Figure 4.
Laboratory-based computed tomography image of the tibial joint surface from a 20-month-old C57BL6 female mouse. The distribution of the areal number density of bridges is superimposed on the tibial joint surface and each bridge has a color that represents the areal number density at the bridge location.

