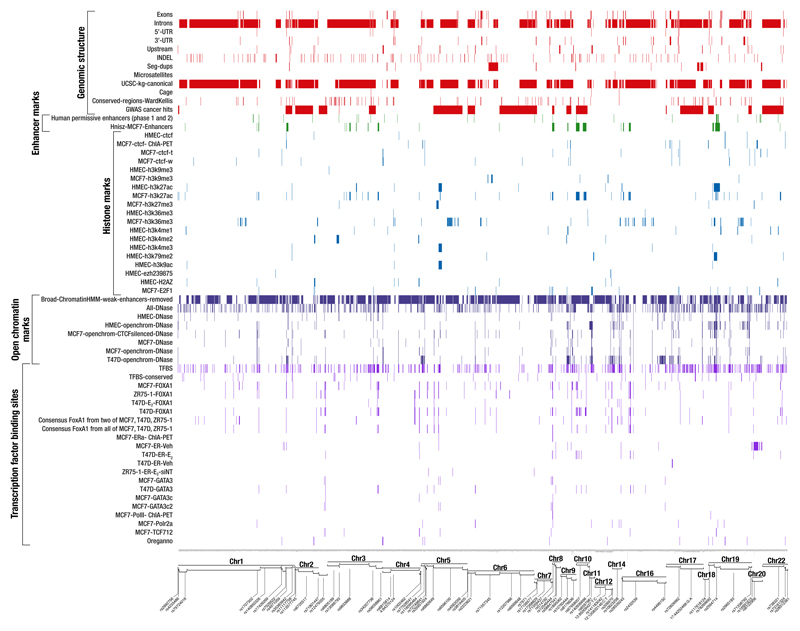
Extended data Figure 1. Global mapping of biofeatures across novel loci associated with overall breast cancer risk.
The overlaps between potential genomic predictors in relevant breast cell lines and candidate causal risk variants (CRVs) within each locus. On the x-axis, each column represents a CRV (see Online Methods). The most significant SNPs are identified in each region. On the y-axis, biofeatures are grouped into five functional categories: genomic structure (red), enhancer marks (dark green), histone marks (blue), open chromatin marks (dark blue) and transcription factor binding sites (dark violet). Colored elements indicate SNPs for which the feature is present. For data sources, see Online Methods (“In-Silico Analysis of CRVs”).

