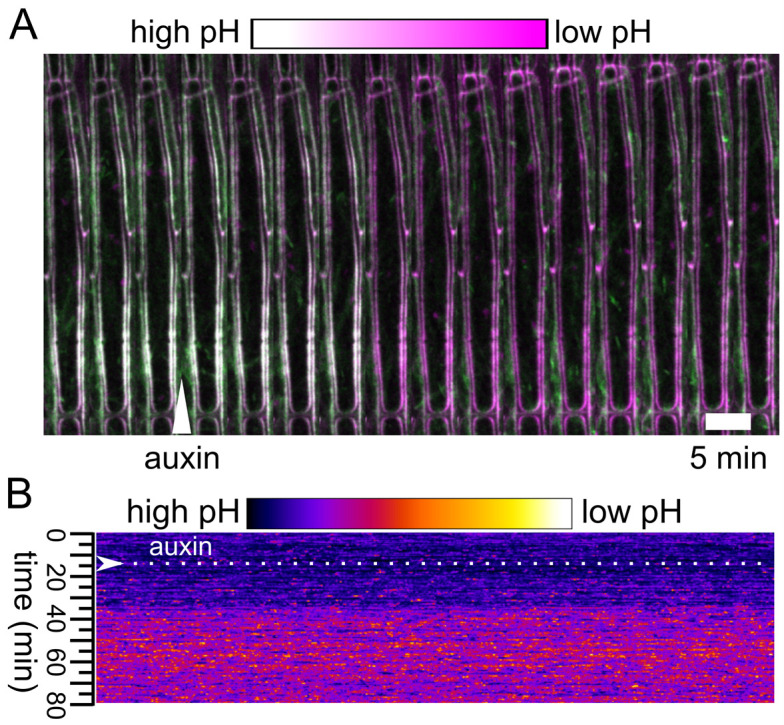
Figure 5. Analysis of the apoplast pH.

A. The apoplast pH after application of auxin to a hypocotyl expressing the apo-pHusion sensor. Auxin application is indicated with an arrowhead, GFP is shown in green while RFP in magenta. B. The output of the AreaKymo MATLAB® script. Time is progressing from top to bottom; ratio of the two fluorophores is shown using the ‘FIRE’ look-up-table.
