. 2017 Dec 1;1(4):381–414. doi: 10.1162/NETN_a_00018

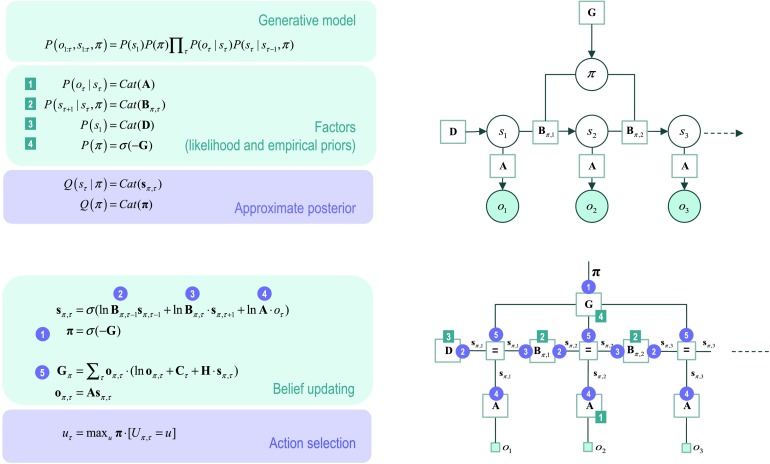
Figure 1. . Generative model for discrete states and outcomes.Upper left panel: These equations specify the generative model. A generative model is the joint probability of outcomes or consequences and their (latent or hidden) causes; see first equation. Usually, the model is expressed in terms of a likelihood (the probability of consequences given causes) and priors over causes. When a prior depends upon a random variable it is called an empirical prior. Here, the likelihood is specified by a matrix A whose elements are the probability of an outcome under every combination of hidden states. Cat denotes a categorical probability distribution. The empirical priors pertain to probabilistic transitions (in the B matrix) among hidden states that can depend upon actions, which are determined by policies (sequences of actions encoded by π). The key aspect of this generative model is that policies are more probable a priori if they minimize the (time integral of) expected free energy G,which depends upon prior preferences about outcomes or costs encoded in Cand the uncertainty or ambiguity about outcomes under each state, encoded by H. Finally, the vector D specifies the initial state. This completes the specification of the model in terms of parameters that constitute A, B, C, and D. Bayesian model inversion refers to the inverse mapping from consequences to causes; that is, estimating the hidden states and other variables that cause outcomes. In approximate Bayesian inference, one specifies the form of an approximate posterior distribution. This particular form in this paper uses a mean field approximation, in which posterior beliefs are approximated by the product of marginal distributions over time points. Subscripts index time (or policy). See the main text and Table 1a in Friston, Parr, et al. (2017) for a detailed explanation of the variables (italic variables represent hidden states, while bold variables indicate expectations about those states).Upper right panel: This Bayesian network represents the conditional dependencies among hidden states and how they cause outcomes. Open circles are random variables (hidden states and policies), while filled circles denote observable outcomes. Squares indicate fixed or known variables, such as the model parameters. We have used a slightly unusual convention where parameters have been placed on top of the edges (conditional dependencies) that may mediate.Lower left panel: These equalities are the belief updates mediating approximate Bayesian inference and action selection. The (Iverson) brackets in the action selection panel return one if the condition in square brackets is satisfied and zero otherwise.Lower right panel: This is an equivalent representation of the Bayesian network in terms of a Forney or normal style factor graph. Here the nodes (square boxes) correspond to factors and the edges are associated with unknown variables. Filled squares denote observable outcomes. The edges are labeled in terms of the sufficient statistics of their marginal posteriors (see approximate posterior). Factors have been labeled intuitively in terms of the parameters encoding the associated probability distributions (on the upper left). The circled numbers correspond to the messages that are passed from nodes to edges (the labels are placed on the edge that carries the message from each node). These correspond to the messages implicit in the belief updates (on the lower left).

Figure 1.