. 2017 Dec 1;1(4):381–414. doi: 10.1162/NETN_a_00018

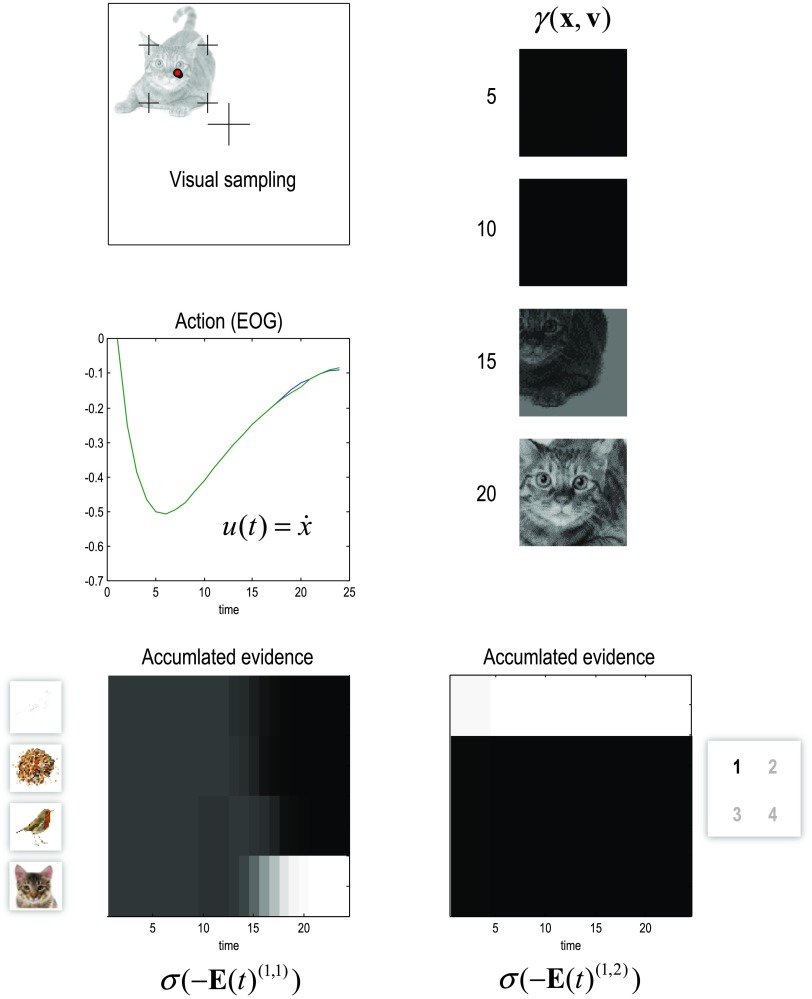
Figure 13. . Visual sampling. Upper left: Final location of a saccadic eye movement (from the center of the visual field) indicated by a red dot. The green dot is where the subject thought she was looking. The crosshairs demark the field of view. Middle left: This plot shows action that corresponds to the motion (in two dimensions) of the hidden state describing the current center of gaze. This trajectory is shown as a function of the time steps used to integrate the generalized belief updating (24 time steps, each corresponding to about 10 ms of real time). Upper right: These panels showed the visual samples every five time steps. Note that the luminance contrast increases as the center of gaze approaches the target location. Lower panels: These panels illustrate evidence accumulation during the (continuous) saccadic sampling in terms of the posterior probability over (discrete) visual (lower left) and proprioceptive (lower right) outcomes.

Figure 13.