. 2017 Dec 1;1(4):381–414. doi: 10.1162/NETN_a_00018

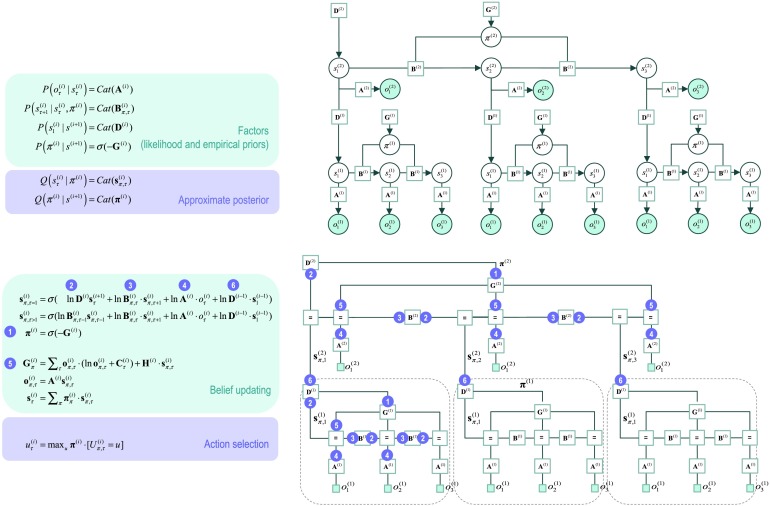
Figure 4. . Deep generative models. This figure provides the Bayesian network and associated Forney factor graph for deep (temporal) generative models, described in terms of probability factors and belief updates on the left. The graphs adopt the same format as Figure 1; however, here the previous model has been extended hierarchically, where (bracketed) superscripts index the hierarchical level. The key aspect of this model is its hierarchical structure that represents sequences of hidden states over time or epochs. In this model, hidden states at higher levels generate the initial states for lower levels—that then unfold to generate a sequence of outcomes; cf. associative chaining (Page & Norris, 1998). Crucially, lower levels cycle over a sequence for each transition of the level above. This is indicated by the subgraphs enclosed in dashed boxes, which are “reused” as higher levels unfold. It is this scheduling that endows the model with deep temporal structure. In relation to the (shallow) models above, the probability distribution over initial states is now conditioned over the state (at the current time) of the level above. Practically, this means that D now becomes a matrix, as opposed to a vector. The messages passed from the corresponding factor node rest on Bayesian model averages that require the expected policies (message 1) and expected states under each policy. The resulting averages are then used to compose descending (message 2) and ascending (message 6) messages that mediate the exchange of empirical priors and posteriors between levels respectively.

Figure 4.