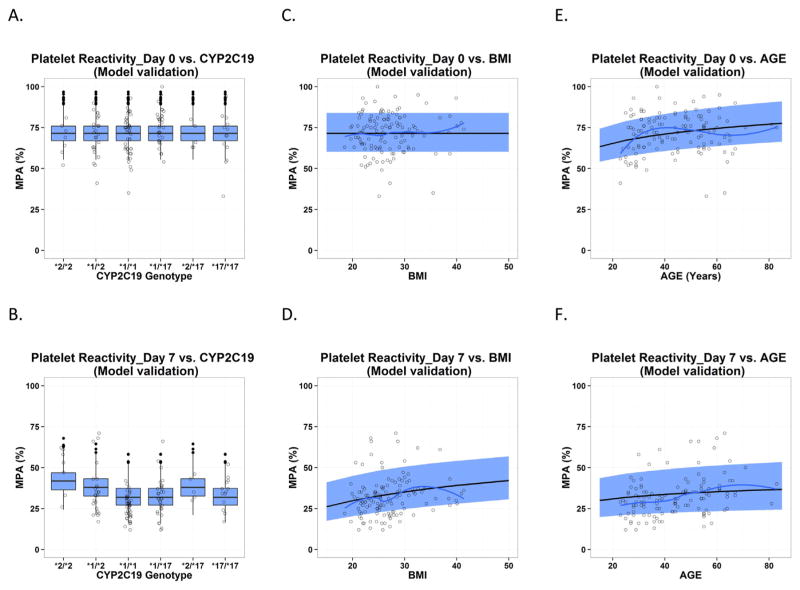
Fig. 5.
Predictive check for PAPI study data used in model qualification, which is presented as the impact of CYP2C19 polymorphism, BMI and age on platelet reactivity (expressed as maximal platelet aggregation (MPA)) on Day 0 at baseline (A, C and E) and on Day 7 after clopidogrel treatment (B, D and F). Each individual plot presents individual observed data (circles), loess smoothing line of the observed data (black solid line), the median (gray dashed line) and 90% confidence interval (semitransparent light gray field) for model predictions by age and BMI, and boxplot for model predictions by CYP2C19 polymorphism.

