
Fig. 6.
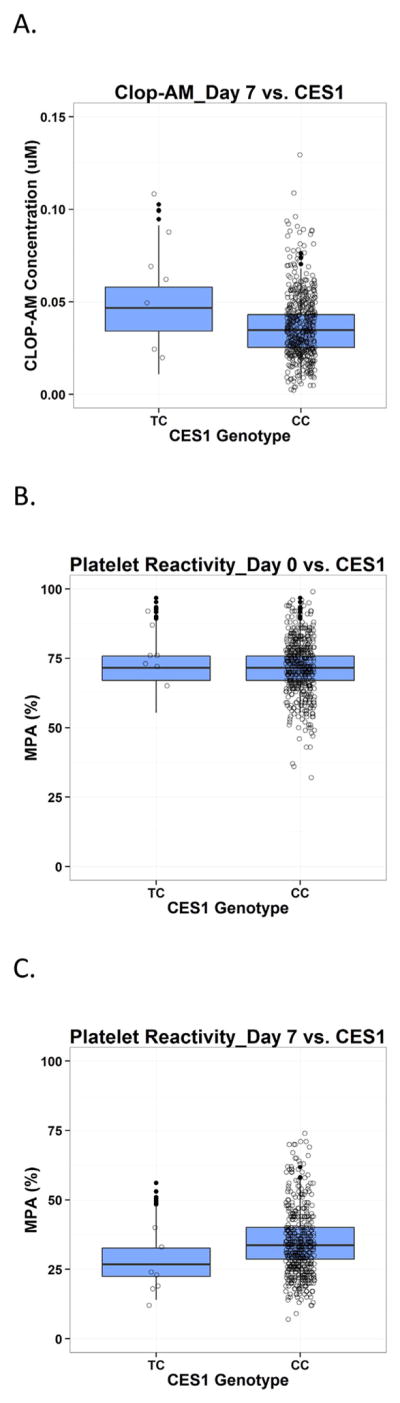
Predictive check for PAPI study data on the impact of CES1 polymorphism on clopidogrel active metabolite (CLOP-AM) PK (A) as well as platelet reactivity (expressed as maximal platelet aggregation (MPA)) on Day 0 at baseline (B) and on Day 7 after clopidogrel treatment (C). Each individual plot presents individual observed data (circles) and boxplots for model predictions. TC: CES1 G143E mutation carriers; CC: CES1 wild-type subjects.