
Figure 1. Crystal structure of human TEFM.
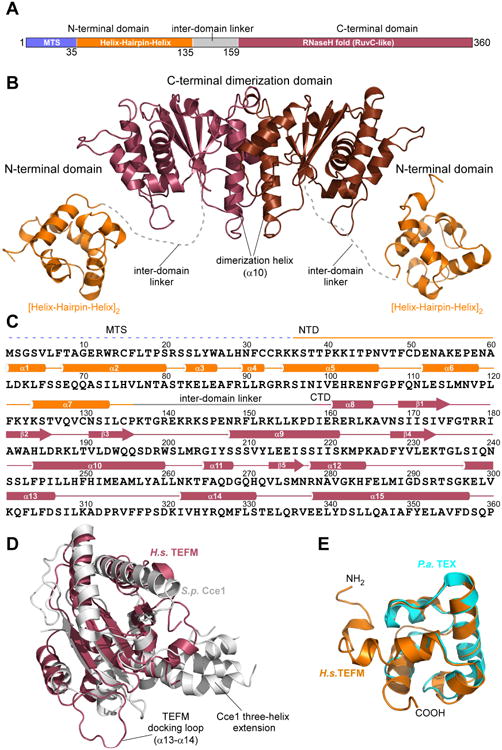
(A) Schematic representation of human TEFM with residue numbers indicated. Domains identified by sequence-based homology prediction are depicted in different colors: mitochondrial targeting sequence (MTS): blue; N-terminal domain (NTD): orange; C-terminal domain (CTD): raspberry, inter-domain linker: gray.
(B). A ribbon model of TEFM with the major domains and structural elements indicated. The C-terminal dimeric domain (CTD) is in brown/raspberry, the N-terminal domains (NTD) in orange. The inter-domain linker is represented by a dashed, grey line.
(C). Schematics of the primary and secondary structures of TEFM.
(D). Structural alignment of TEFM CTD (raspberry) and fission yeast Holliday junction resolvase Cce1 (PDB ID 1KCF) (grey).
(E). Structural alignment of TEFM NTD (orange) and bacterial (P. aeroginosa) transcription factor TEX (PDB ID 3BZC) (cyan). See also Table S1, Figure S1