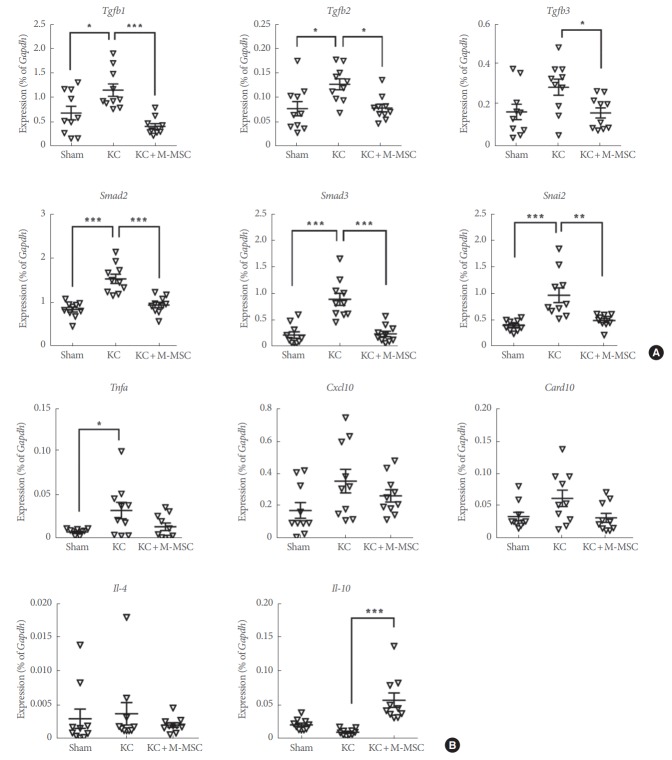
Fig. 8.
Real-time quantitative polymerase chain reaction analysis of fibrosis (A) and inflammation (B)-related genes in the indicated bladder tissues. Expression is presented as % Gapdh and shown as dot plot with the mean±standard error of the mean (*P<0.05, **P<0.01, and ***P<0.001 compared with KC group). KC, ketamine-induced cystitis; M-MSC, multipotent mesenchymal stem cell.

