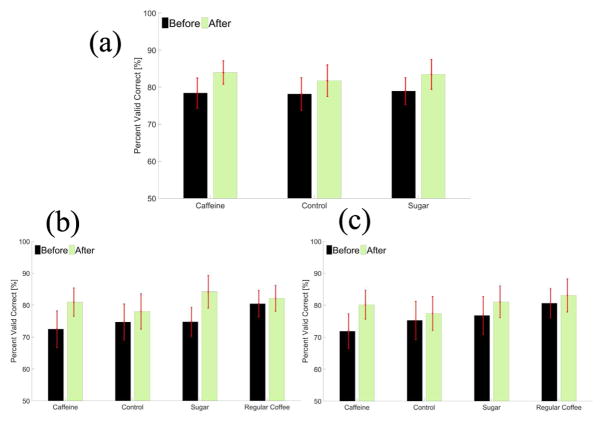
Fig. 2.
(a) Average PVC performance evaluation of L/R cursor control including both group one and group two ± standard error mean (SEM) for each soft drink group before and after coke consumption. (b) Average PVC performance measure of L/R cursor control for group two ± standard error mean (SEM) for each drink group before and after drink consumption. (c) Average PVC performance measure of U/D cursor control for group two ± standard error mean (SEM) for each drink group before and after drink consumption.

