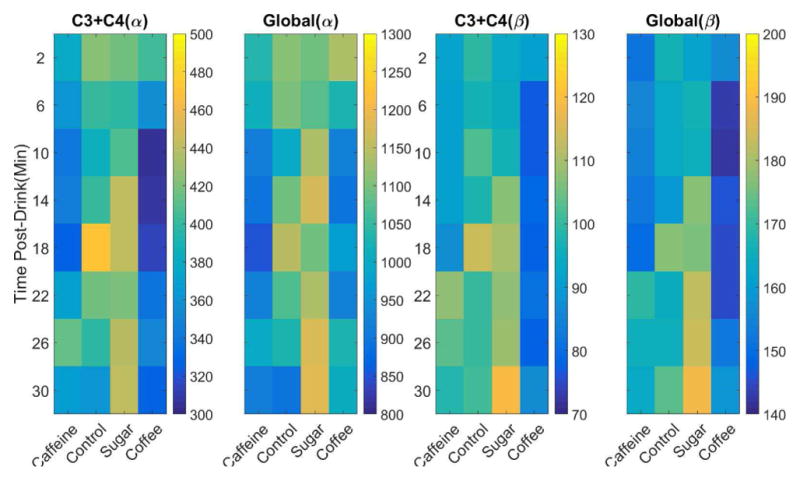
Fig. 6.

Average channel C3 + C4 and global average of resting state power for eyes closed periods. Power is calculated by alpha (α, 10–14Hz) and beta (β, 14–26Hz) frequency bands separately and averaged across each two minutes eye closed periods for each drink group. Power values (unit, μV2) are represented via color where a color bar shows the scale of value for each panel and ordered by number of minutes since the soft drink consumption.
