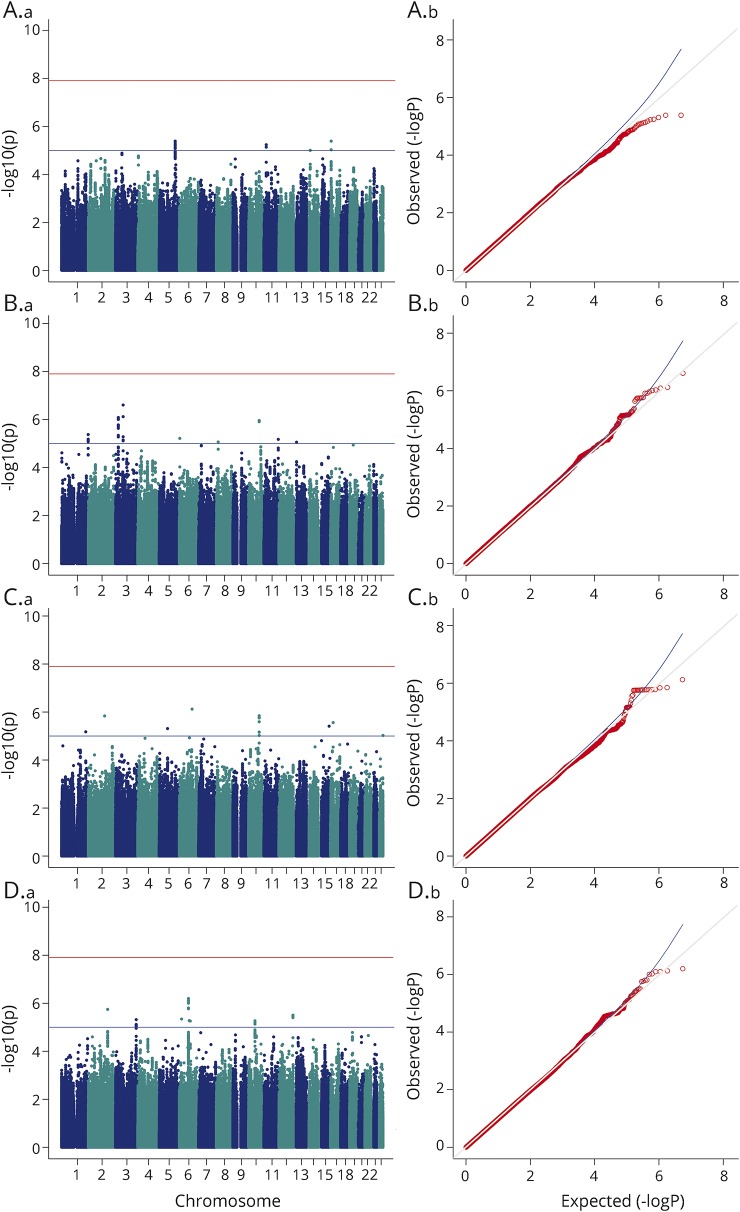
Figure 1. Meta-analysis results across European and Han Chinese cohorts.
Manhattan (a) and quantile–quantile (b) plots for the meta-analyses of maculopapular exanthema vs tolerant controls, for (A) any antiepileptic drug (genomic inflation factor [λ] = 1.01), (B) carbamazepine (λ = 1.01), (C) lamotrigine (λ = 0.99), and (D) phenytoin (λ = 0.98).

