Fig. 4.
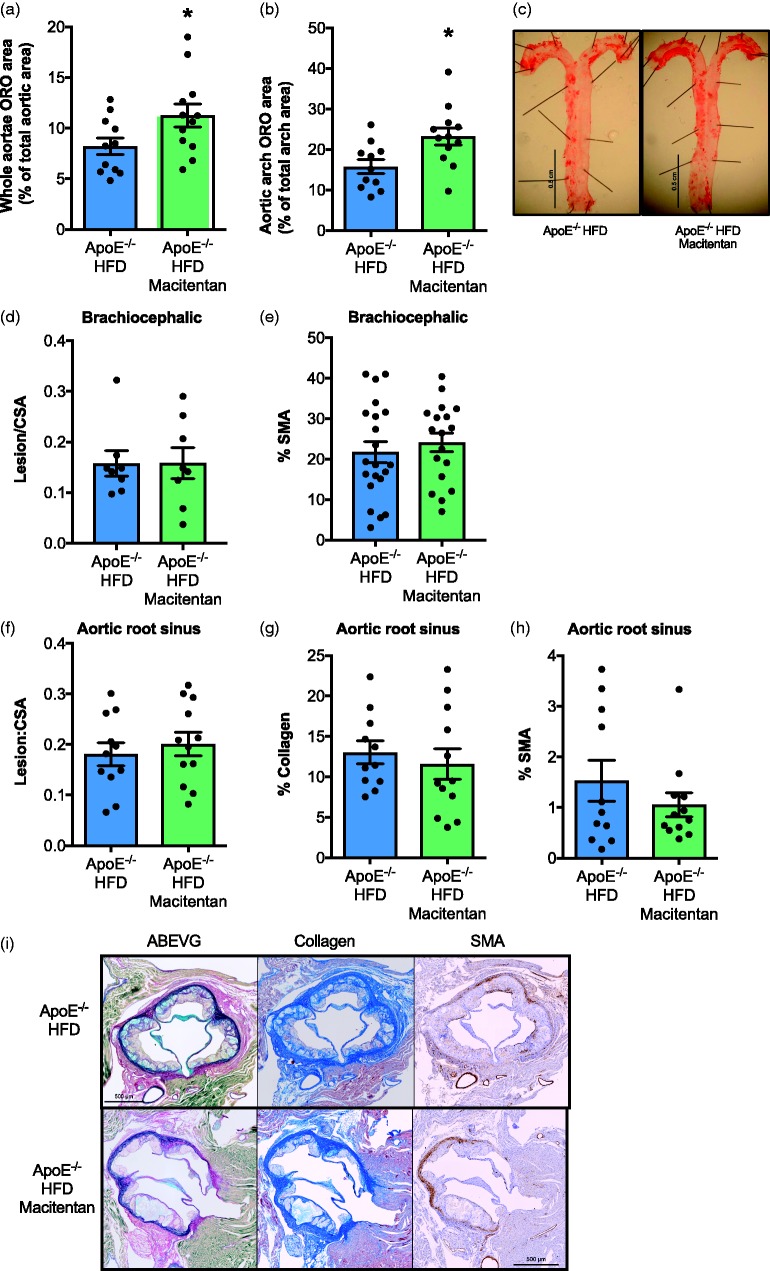
Macitentan treatment does not alter the composition or atherosclerotic burden in HFD-fed ApoE−/− mice. Bar charts show ORO stain as a % of total aortic area (a), and within the aortic arch as a % of total arch area (b). (c) Representative images of ORO in control and macitentan-treated mice. (d) Bar charts show the ratio of atherosclerotic lesion area within the brachiocephalic artery normalized to cross-sectional area, and (d) the % α-SMA positive tissue within the brachiocephalic sections. (f) The ratio of lesion area to cross-sectional area within the aortic root sinus, (g) % collagen content, and (h) % α-SMA positive tissue in aortic root sections. (i) Representative aortic root histological sections from control and macitentan-treated HFD-fed ApoE−/− mice stained with ABEVG, martius scarlet blue (collagen), and α-SMA. Bars represent mean ± SEM. Statistical differences between sections from treated and untreated mice were assessed by Mann–Whitney U test, n = 11–12. Individual mice are represented by dots. *P < 0.05. Statistical differences between groups were measured by Mann–Whitney U test.

