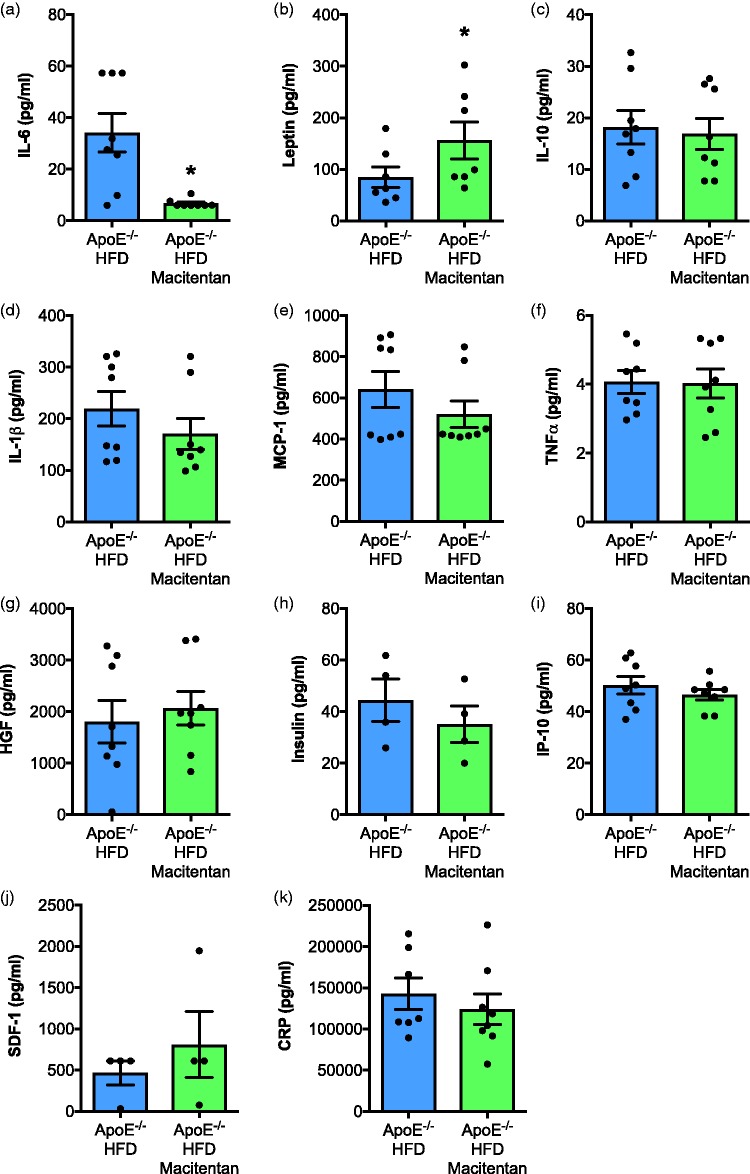
Fig. 5.
Macitentan treatment induces changes in inflammatory plasma cytokines in HFD-fed ApoE−/− mice. Bar charts show the plasma concentration of (a) IL-6, (b) leptin, (c) IL-10, (d) IL-1β, (e) MCP-1, (f) TNF-α, (g) HGF, (h) insulin, (i) IP-10, (j) SDF-1, and (k) CRP. Bar graphs represent mean ± SEM, n = 4–9 with individual animals represented by dots. *P < 0.05. Statistical differences were assessed by Mann–Whitney U test.

