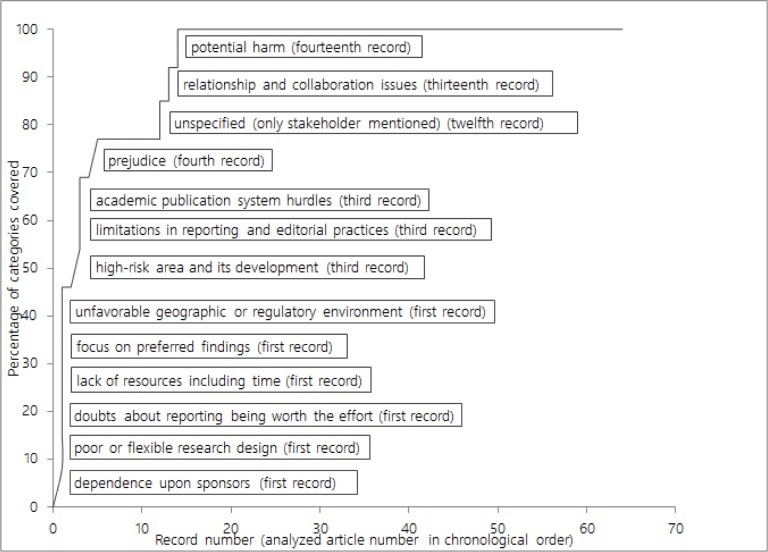
Fig 2. Saturation graph.
The horizontal axis displays the articles (records) in chronological order of analysis. The vertical axis displays the percentage of the 12 (plus 1 unspecified) determinant categories containing at least one determinant. The labels describe which determinant category appeared for the first time in which record.

