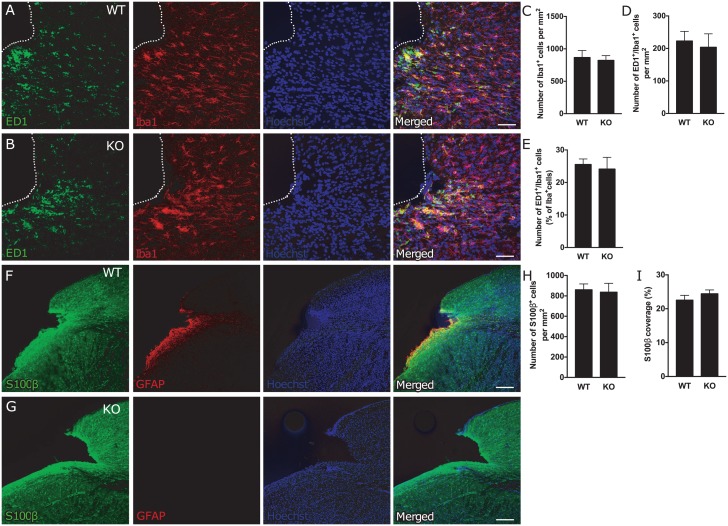
Fig 3. Attenuation of reactive gliosis does not alter number or activation of microglia/macrophages and the number of astrocytes in the region adjacent to the ischemic lesion.
(A-B) Representative images of microglia/macrophage activation, as shown by ED1 (green) and Iba1 (red) immunostaining, around the stroke lesion in WT (A) and GFAP-/-Vim-/- (B) mice. Scale bar = 50μm. (C-E) Total number of microglia/macrophages (Iba1+ cells, C), and number (ED1+/Iba1+ cells, D) and percentage (ED1+/Iba1+ cells of total number of Iba1+ cells, E) of activated microglia in the area around the ischemic lesion up to 1 mm from the lesion core in WT (n = 9) and GFAP-/-Vim-/- (n = 6) mice. Means ± SEM. KO = GFAP-/-Vim-/- mice. (F-G) Representative confocal images of the cortical lesion in WT and GFAP-/-Vim-/- mice at 9 weeks after dMCAO, immunostained for GFAP (red) and S100β (green). Scale bar = 200 μm. (H-I) Quantification of astrocytes around the stroke lesion (1 mm around the lesion core) expressed as number of S100β+ cells per mm2 (H) and the relative S100β+ area (I) (WT n = 9; GFAP-/-Vim-/- n = 6). Means ± SEM. KO = GFAP-/-Vim-/- mice.

