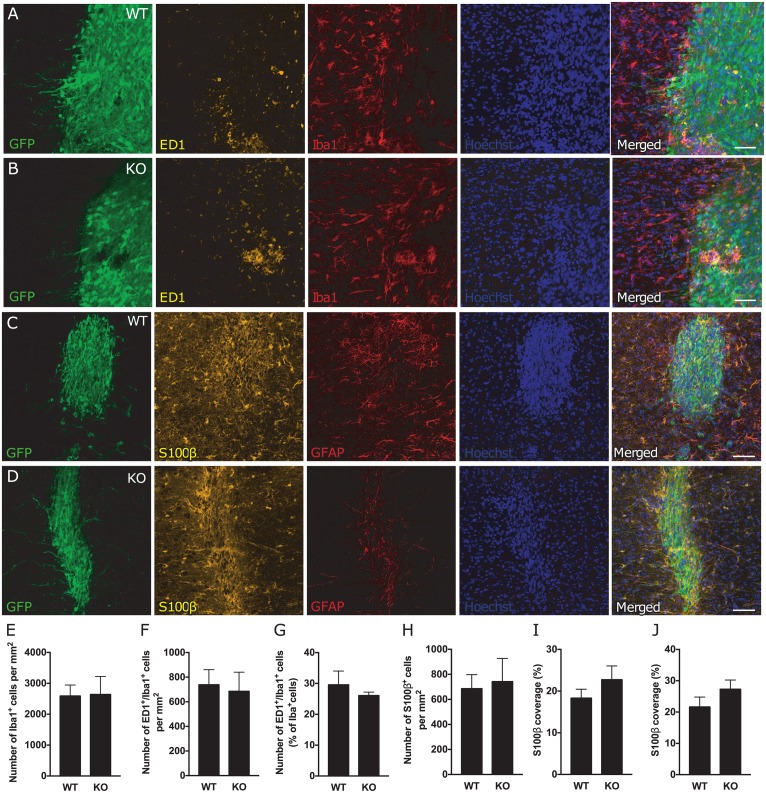
Fig 4. Attenuation of reactive gliosis does not alter numbers or activation of microglia/macrophages and the number of astrocytes in the region of the transplant after dMCAO.
(A-B) Representative images of microglia/macrophage activation via ED1 (yellow) and Iba1 (red) staining, around the transplant (GFP+ cells, green) in WT (A) and KO (B) mice. Scale bar = 50μm. (C-D) Representative confocal images of a transplant in WT and GFAP-/-Vim-/- mice at nine weeks after dMCAO showing the transplanted cells (GFP+ cells, green) and astrocytes stained for S100β (yellow) and GFAP (red). Scale bar = 100 μm. (E-G) Total number of microglia/macrophages (Iba1+ cells, E) and number (ED1+/Iba1+ cells, F) and percentage (ED1+/Iba1+ cells of total number of Iba1+ cells, G) activated microglia in the area inside and around the transplant in WT (n = 9) and GFAP-/-Vim-/- (n = 4) mice. Means ± SEM. KO = GFAP-/-Vim-/- mice. (H-J) Quantification of astrocytes in the area of the transplant (including the area 100 μm from the transplant) expressed as number of S100β+ cells per mm2 (H) and the relative S100β+ area around (I) and inside (J) the transplant (GFP+ cells, green) (WT n = 8; GFAP-/-Vim-/- n = 5). Means ± SEM. KO = GFAP-/-Vim-/- mice.

