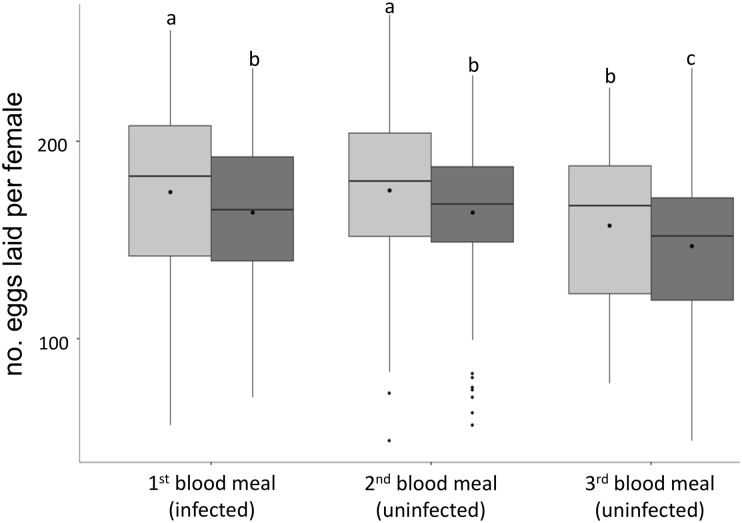
Fig 2. Impact of Plasmodium infection on the number of eggs laid by mosquitoes during three consecutive gonotrophic cycles.
Boxplots of the number of eggs laid per female fed on control uninfected (light grey boxes) or Plasmodium -infected birds (dark grey boxes). Only the first blood meal was infected by P. relictum (in the case of the dark box). Boxplots represent the means (points) and medians (horizontal lines). Boxes above and below the medians show the first and third quartiles respectively, lines delimit 1.5 times the inter-quartile range, above which individual counts are considered outliers and marked as full circles Different letters (above boxplots) indicate significant differences between the number of eggs laid by different mosquito group based on contrast analysis test p < 0.05.

