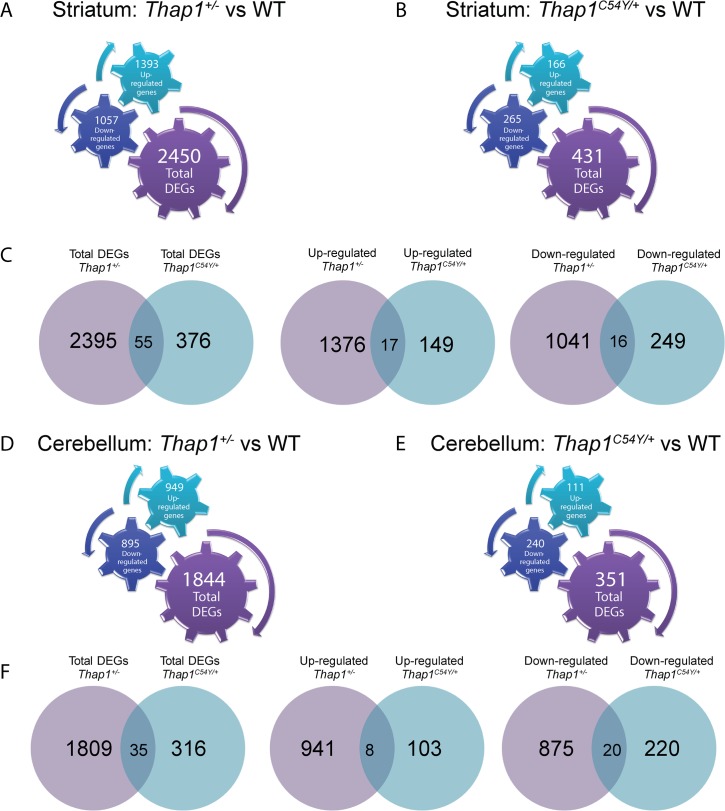
Fig 1. Global analysis of differential gene expression in striatum and cerebellum of Thap1+/- or Thap1C54Y/+ vs WT.
RNA-Seq was used to identify differentially expressed genes (DEGs) in the heterozygote Thap1+/- and Thap1C54Y P1 striatum and cerebellum as compared to WT. Diagrams show number of total DEGs as well as the number of up- or down-regulated genes in the (A) Thap1+/- striatum vs WT (B) Thap1C54Y striatum vs WT. (C) Venn diagrams show the number of overlapping DEGs (total, up-regulated or down-regulated) between Thap1+/- and Thap1C54Y/+ relative to WT striatum. Diagrams show number of total DEGs as well as the number of up- or down-regulated genes in the (D) Thap1+/- cerebellum vs WT (E) Thap1C54Y/+ cerebellum vs WT. (F) Venn diagrams show the number of overlapping DEGs (total, up-regulated or down-regulated) between Thap1+/- and Thap1C54Y/+ relative to WT cerebellum. Cogged gears in panels A, B, D and E represent the number and the direction of the differentially expressed genes for each genotype and brain region, as follows: up-regulated genes (turquoise color, upward right arrow); down-regulated genes (dark blue color, downward left arrow); total [number] of genes (purple color, downward right arrow).

