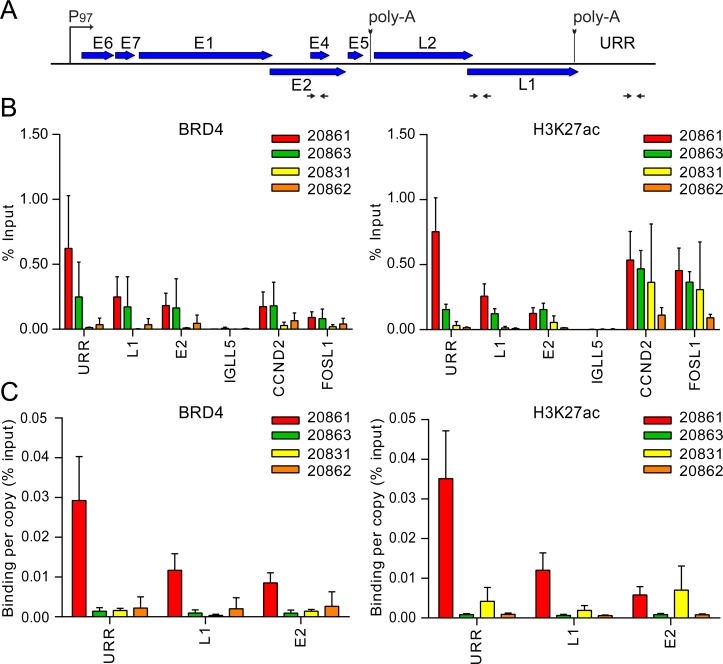
Fig 6. Super-enhancer markers are enriched over the viral URR in 20861, but not other integrated W12 sub-clones.
Chromatin immunoprecipitation (ChIP) was performed in 20861, 20863, 20831 and 20862 cells using antibodies against Brd4 and H3K27ac. A, Map of linearized HPV16 genome showing primer positions (denoted by black horizontal arrows) for the upstream regulatory region (URR), L1 and E2. B, ChIP DNA samples were analyzed by real-time qPCR using primers against target promoters, indicated in panel A. ChIP signals were expressed as the percentage of immunoprecipitated chromatin DNA relative to the total amount of input chromatin (% Input). CCND2 and FOSL1 were included as positive controls for super-enhancer loci; IGLL5 was included as a negative control for Brd4 binding in these cells. C, To account for variations in viral copy number between W12 cells, ChIP signals were expressed as binding per single-copy genome. Background signal at each locus (measured by no-antibody controls) was subtracted from corresponding ChIP signals. Average binding levels were calculated from three independent experiments. Error bars represent SD. Note that similar experiments were previously conducted on 20861 and 20863 cells (using different datasets) [22].

