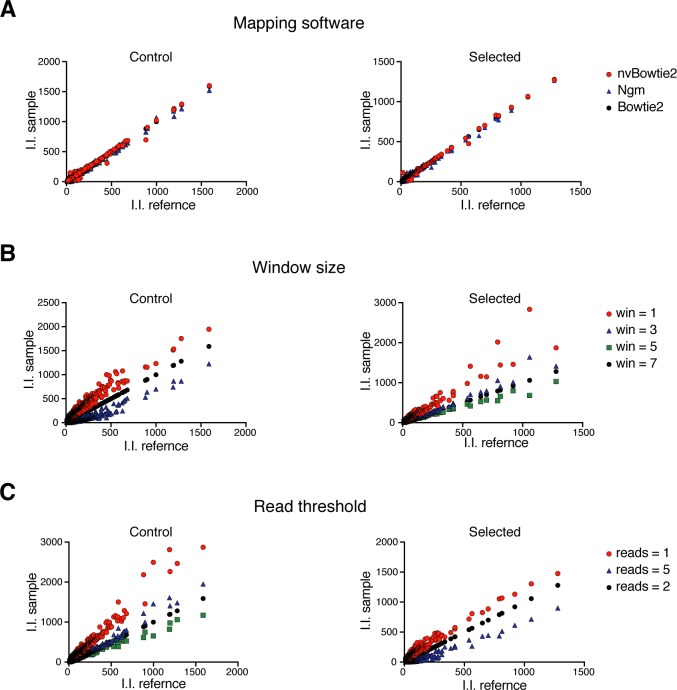
Fig 3. Effects of analysis parameters on candidate identification.
(A) Comparison of the number of I.I. that were obtained by using different read mapping tools. Genes with more than 10 insertions are plotted and the sample aligned with Bowtie2 is used as reference (I.I. reference). (B) Effect of genomic window size on defining I.I. from reads. Genes with more than 10 insertions are plotted and a 5 nucleotide window is used as reference (I.I. reference). (C) Effect of read number threshold on defining I.I.. Genes with more than 10 insertions are plotted and a threshold for 2 reads is used as reference (I.I. reference).

